Philips 2008 Annual Report Download - page 108
Download and view the complete annual report
Please find page 108 of the 2008 Philips annual report below. You can navigate through the pages in the report by either clicking on the pages listed below, or by using the keyword search tool below to find specific information within the annual report.-
 1
1 -
2
-
3
-
4
-
5
-
6
-
7
-
8
-
9
-
10
-
11
-
12
-
13
-
14
-
15
-
16
-
17
-
18
-
19
-
20
-
21
-
22
-
23
-
24
-
25
-
26
-
27
-
28
-
29
-
30
-
31
-
32
-
33
-
34
-
35
-
36
-
37
-
38
-
39
-
40
-
41
-
42
-
43
-
44
-
45
-
46
-
47
-
48
-
49
-
50
-
51
-
52
-
53
-
54
-
55
-
56
-
57
-
58
-
59
-
60
-
61
-
62
-
63
-
64
-
65
-
66
-
67
-
68
-
69
-
70
-
71
-
72
-
73
-
74
-
75
-
76
-
77
-
78
-
79
-
80
-
81
-
82
-
83
-
84
-
85
-
86
-
87
-
88
-
89
-
90
-
91
-
92
-
93
-
94
-
95
-
96
-
97
-
 98
98 -
 99
99 -
 100
100 -
 101
101 -
 102
102 -
 103
103 -
 104
104 -
 105
105 -
 106
106 -
 107
107 -
 108
108 -
 109
109 -
 110
110 -
 111
111 -
 112
112 -
 113
113 -
 114
114 -
 115
115 -
 116
116 -
 117
117 -
 118
118 -
119
-
120
-
121
-
122
-
123
-
124
-
125
-
126
-
127
-
128
-
129
-
130
-
131
-
132
-
133
-
134
-
135
-
136
-
137
-
138
-
139
-
140
-
141
-
142
-
143
-
144
-
145
-
146
-
147
-
148
-
149
-
150
-
151
-
152
-
153
-
154
-
155
-
156
-
157
-
158
-
159
-
160
-
161
-
162
-
163
-
164
-
165
-
166
-
167
-
168
-
169
-
170
-
171
-
172
-
173
-
174
-
175
-
176
-
177
-
178
-
179
-
180
-
181
-
182
-
183
-
184
-
185
-
186
-
187
-
188
-
189
-
190
-
191
-
192
-
193
-
194
-
195
-
196
-
197
-
198
-
199
-
200
-
201
-
202
-
203
-
204
-
205
-
206
-
207
-
208
-
209
-
210
-
211
-
212
-
213
-
214
-
215
-
216
-
217
-
218
-
219
-
220
-
221
-
222
-
223
-
224
-
225
-
226
-
227
-
228
-
229
-
230
-
231
-
232
-
233
-
234
-
235
-
236
-
237
-
238
-
239
-
240
-
241
-
242
-
243
-
244
-
245
-
246
-
247
-
248
-
249
-
250
-
251
-
252
-
253
-
254
-
255
-
256
-
257
-
258
-
259
-
260
-
261
-
262
-
263
-
264
-
265
-
266
-
267
-
268
-
269
-
270
-
271
-
272
-
273
-
274
-
275
-
276
 |
 |

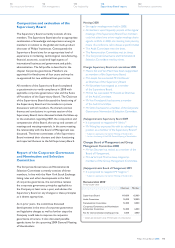
Details of fiscal risks
Philips is, as mentioned before, exposed to fiscal
uncertainties. This section further describes this
exposure. Please refer to note 6 and note 42 for
additional disclosure relating to income taxes.
Transfer pricing uncertainties
Philips has issued transfer pricing directives, which
are in accordance with guidelines of the Organization
of Economic Co-operation and Development. As
transfer pricing has a cross-border effect, the focus of
local tax authorities on implemented transfer pricing
procedures in a country may have an impact on results
in another country. In order to mitigate the transfer
pricing uncertainties, audits are executed on a regular
basis to safeguard the correct implementation of the
transfer pricing directives.
Tax uncertainties on general service agreements
and specific allocation contracts
Due to the centralization of certain activities in
a limited number of countries (such as research and
development, centralized IT, and corporate functions
and head office), costs are also centralized. As a
consequence, for tax reasons these costs and/or
revenues must be allocated to the beneficiaries,
i.e. the various Philips entities. For that purpose,
apart from specific allocation contracts for costs and
revenues, general service agreements (GSAs) are
signed with a large number of entities. Tax authorities
review the implementation of GSAs, apply benefit
tests for particular countries or audit the use of tax
credits attached to GSAs and royalty payments, and
may reject the implemented procedures. Furthermore,
buy in/out situations in the case of (de)mergers could
affect the tax allocation of GSAs between countries.
The same applies to the specific allocation contracts.
Tax uncertainties due to disentanglements
and acquisitions
When a subsidiary of Philips is disentangled, or a new
company is acquired, related tax uncertainties arise.
Philips creates merger and acquisition (M&A) teams
for these disentanglements or acquisitions. These
teams consist of specialists from various corporate
functions and are formed, amongst other things, to
identify hidden tax uncertainties that could
subsequently surface when companies are acquired
and to avoid tax claims related to disentangled
entities. These tax uncertainties are investigated and
assessed to mitigate tax uncertainties in the future
as much as possible. Several tax uncertainties may
surface from M&A activities. Examples of uncertainties
are: applicability of the participation exemption,
allocation issues, and non-deductibility of parts of
the purchase price.
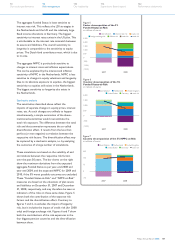
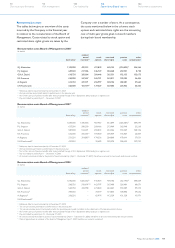
The differences between the first and second bars
in figures 5, 6 and 7 reflect plan changes, changes in
assumptions for discounting future liabilities and
changes in financial market conditions during 2008.
The Funded-Status-at-Risk has decreased compared
to 2007. The additional steps taken during 2008 in the
Netherlands and the US to fully implement their new
investment strategies have led to lower contributions
of interest rate and equity risk. The contribution
of equity risk has also decreased due to the lower
absolute exposure that resulted from negative market
returns in 2008. Nevertheless, equity risk is still a
major source of risk. It results from the relatively
large strategic allocation to equities in the US and
the large absolute exposure to equities in the Dutch
fund. The contribution of interest rate risk results
from the remaining interest rate mismatch between
assets and liabilities. Both in absolute and relative
terms, it is biggest in the US. Credit risk results mainly
from the mismatch between the credit spread risk
exposure of (the discount rate curve used for valuing)
liabilities and the credit exposure of assets (through
defaults, downgrades and changing credit spreads).
The Dutch fund contributes most to inflation risk, due
to its size and its indexation policy. Foreign exchange
risk has increased compared to 2007, as the increased
deficits in the UK and especially the US lead to higher
translation risks. The diversification effect is largely
attributable to the positive correlation between
inflation and interest rates and the negative correlation
between bonds and equities.
The Dutch fund still contributes most to NPPC-at-Risk.
This is a reflection of its size.
Philips Annual Report 2008108
42
Our group performance
18
We care about...
8
Message from
the President
6
Performance highlights
14
Who we are