Philips 2008 Annual Report Download - page 175
Download and view the complete annual report
Please find page 175 of the 2008 Philips annual report below. You can navigate through the pages in the report by either clicking on the pages listed below, or by using the keyword search tool below to find specific information within the annual report.-
 1
1 -
2
-
3
-
4
-
5
-
6
-
7
-
8
-
9
-
10
-
11
-
12
-
13
-
14
-
15
-
16
-
17
-
18
-
19
-
20
-
21
-
22
-
23
-
24
-
25
-
26
-
27
-
28
-
29
-
30
-
31
-
32
-
33
-
34
-
35
-
36
-
37
-
38
-
39
-
40
-
41
-
42
-
43
-
44
-
45
-
46
-
47
-
48
-
49
-
50
-
51
-
52
-
53
-
54
-
55
-
56
-
57
-
58
-
59
-
60
-
61
-
62
-
63
-
64
-
65
-
66
-
67
-
68
-
69
-
70
-
71
-
72
-
73
-
74
-
75
-
76
-
77
-
78
-
79
-
80
-
81
-
82
-
83
-
84
-
85
-
86
-
87
-
88
-
89
-
90
-
91
-
92
-
93
-
94
-
95
-
96
-
97
-
98
-
99
-
100
-
101
-
102
-
103
-
104
-
105
-
106
-
107
-
108
-
109
-
110
-
111
-
112
-
113
-
114
-
115
-
116
-
117
-
118
-
119
-
120
-
121
-
122
-
123
-
124
-
125
-
126
-
127
-
128
-
129
-
130
-
131
-
132
-
133
-
134
-
135
-
136
-
137
-
138
-
139
-
140
-
141
-
142
-
143
-
144
-
145
-
146
-
147
-
148
-
149
-
150
-
151
-
152
-
153
-
154
-
155
-
156
-
157
-
158
-
159
-
160
-
161
-
162
-
163
-
164
-
 165
165 -
 166
166 -
 167
167 -
 168
168 -
 169
169 -
 170
170 -
 171
171 -
 172
172 -
 173
173 -
 174
174 -
 175
175 -
 176
176 -
 177
177 -
 178
178 -
 179
179 -
 180
180 -
 181
181 -
 182
182 -
 183
183 -
 184
184 -
 185
185 -
186
-
187
-
188
-
189
-
190
-
191
-
192
-
193
-
194
-
195
-
196
-
197
-
198
-
199
-
200
-
201
-
202
-
203
-
204
-
205
-
206
-
207
-
208
-
209
-
210
-
211
-
212
-
213
-
214
-
215
-
216
-
217
-
218
-
219
-
220
-
221
-
222
-
223
-
224
-
225
-
226
-
227
-
228
-
229
-
230
-
231
-
232
-
233
-
234
-
235
-
236
-
237
-
238
-
239
-
240
-
241
-
242
-
243
-
244
-
245
-
246
-
247
-
248
-
249
-
250
-
251
-
252
-
253
-
254
-
255
-
256
-
257
-
258
-
259
-
260
-
261
-
262
-
263
-
264
-
265
-
266
-
267
-
268
-
269
-
270
-
271
-
272
-
273
-
274
-
275
-
276
 |
 |

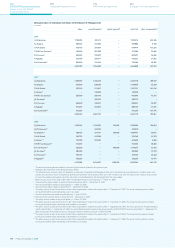
The tables below give an overview of the interests of the members of the Board of Management under the restricted share rights plans
and the stock option plans of the Company:
Number of restricted share rights
as of Jan. 1, 2008
awarded during
2008
released during
2008
as of Dec. 31,
20082)
potential
premium shares
G.J. Kleisterlee 40,644 22,401 18,882 44,163 19,121
P-J. Sivignon 25,191 12,801 11,990 26,002 9,762
G.H.A. Dutiné 23,424 12,801 11,290 24,935 11,546
R.S. Provoost 22,5351) 12,801 10,401 24,935 10,653
A. Ragnetti 21,8671) 12,801 10,067 24,601 9,814
S.H. Rusckowski 26,1011) 12,801 12,567 26,335 11,678
159,762 86,406 75,197 170,971 72,574
Partly awarded before date of appointment as a member of the Board of Management
1)
Excluding premium shares
2)
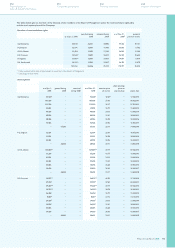
Stock options
as of Jan. 1,
2008
granted during
2008
exercised
during 2008
as of Dec. 31,
2008
exercise price
(in euros)
share (closing)
price on
exercise date expiry date
G.J. Kleisterlee 52,5001) −−52,5001) 42.243) −17.02.2010
105,000 −−105,000 37.60 −08.02.2011
115,200 −−115,200 30.17 −07.02.2012
52,803 −−52,803 16.77 −15.04.2013
48,006 −−48,006 24.13 −13.04.2014
48,006 −−48,006 19.41 −18.04.2015
48,006 −−48,006 26.28 −18.04.2016
73,926 −−73,926 30.96 −16.04.2017
−67,203 −67,203 23.11 −14.04.2018
P−J. Sivignon 32,004 −−32,004 22.07 −18.07.2015
33,003 −−33,003 26.28 −18.04.2016
42,903 −−42,903 30.96 −16.04.2017
−38,403 −38,403 23.11 −14.04.2018
G.H.A. Dutiné 124,8001)2) −−124,8001)2) 30.17 −07.02.2012
35,208 −−35,208 16.77 −15.04.2013
32,004 −−32,004 24.13 −13.04.2014
32,004 −−32,004 19.41 −18.04.2015
30,006 −−30,006 26.28 −18.04.2016
39,600 −−39,600 30.96 −16.04.2017
−38,403 −38,403 23.11 −14.04.2018
R.S. Provoost 56,8751)2) −−56,8751)2) 42.90 −17.10.2010
29,7501) −−29,7501) 37.60 −08.02.2011
49,2001)2) −−49,2001)2) 30.17 −07.02.2012
16,2501)2) −−16,2501)2) 34,78 −16.04.2012
26,4061) −−26,4061) 16.77 −15.04.2013
8,6671) −−8,6671) 22.12 −14.10.2013
24,0031) −−24,0031) 24.13 −13.04.2014
24,0031) −−24,0031) 19.41 −18.04.2015
30,006 −−30,006 26.28 −18.04.2016
39,600 −−39,600 30.96 −16.04.2017
−38,403 −38,403 23.11 −14.04.2018
Philips Annual Report 2008 175
254
Corporate governance
250
Reconciliation of
non-US GAAP information
262
Ten-year overview
266
Investor information