Philips 2008 Annual Report Download - page 93
Download and view the complete annual report
Please find page 93 of the 2008 Philips annual report below. You can navigate through the pages in the report by either clicking on the pages listed below, or by using the keyword search tool below to find specific information within the annual report.-
 1
1 -
2
-
3
-
4
-
5
-
6
-
7
-
8
-
9
-
10
-
11
-
12
-
13
-
14
-
15
-
16
-
17
-
18
-
19
-
20
-
21
-
22
-
23
-
24
-
25
-
26
-
27
-
28
-
29
-
30
-
31
-
32
-
33
-
34
-
35
-
36
-
37
-
38
-
39
-
40
-
41
-
42
-
43
-
44
-
45
-
46
-
47
-
48
-
49
-
50
-
51
-
52
-
53
-
54
-
55
-
56
-
57
-
58
-
59
-
60
-
61
-
62
-
63
-
64
-
65
-
66
-
67
-
68
-
69
-
70
-
71
-
72
-
73
-
74
-
75
-
76
-
77
-
78
-
79
-
80
-
81
-
82
-
 83
83 -
 84
84 -
 85
85 -
 86
86 -
 87
87 -
 88
88 -
 89
89 -
 90
90 -
 91
91 -
 92
92 -
 93
93 -
 94
94 -
 95
95 -
 96
96 -
 97
97 -
 98
98 -
 99
99 -
 100
100 -
 101
101 -
 102
102 -
 103
103 -
104
-
105
-
106
-
107
-
108
-
109
-
110
-
111
-
112
-
113
-
114
-
115
-
116
-
117
-
118
-
119
-
120
-
121
-
122
-
123
-
124
-
125
-
126
-
127
-
128
-
129
-
130
-
131
-
132
-
133
-
134
-
135
-
136
-
137
-
138
-
139
-
140
-
141
-
142
-
143
-
144
-
145
-
146
-
147
-
148
-
149
-
150
-
151
-
152
-
153
-
154
-
155
-
156
-
157
-
158
-
159
-
160
-
161
-
162
-
163
-
164
-
165
-
166
-
167
-
168
-
169
-
170
-
171
-
172
-
173
-
174
-
175
-
176
-
177
-
178
-
179
-
180
-
181
-
182
-
183
-
184
-
185
-
186
-
187
-
188
-
189
-
190
-
191
-
192
-
193
-
194
-
195
-
196
-
197
-
198
-
199
-
200
-
201
-
202
-
203
-
204
-
205
-
206
-
207
-
208
-
209
-
210
-
211
-
212
-
213
-
214
-
215
-
216
-
217
-
218
-
219
-
220
-
221
-
222
-
223
-
224
-
225
-
226
-
227
-
228
-
229
-
230
-
231
-
232
-
233
-
234
-
235
-
236
-
237
-
238
-
239
-
240
-
241
-
242
-
243
-
244
-
245
-
246
-
247
-
248
-
249
-
250
-
251
-
252
-
253
-
254
-
255
-
256
-
257
-
258
-
259
-
260
-
261
-
262
-
263
-
264
-
265
-
266
-
267
-
268
-
269
-
270
-
271
-
272
-
273
-
274
-
275
-
276
 |
 |

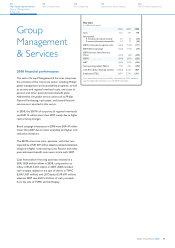
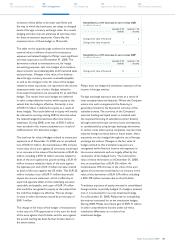
Key data
in millions of euros
2006 2007 2008
Sales 167 197 148
Sales growth
% increase (decrease), nominal 23 18 (25)
% increase (decrease), comparable
14 31 (24)
EBITA Corporate & regional costs (226) (156) (171)
EBITA Brand campaign (126) (111) (64)
EBITA Services Units Pensions,
Other (347) (30) (290)
EBITA (699) (297) (525)
EBIT (699) (297) (525)
Net operating capital (NOC) 209 705 (492)
Cash flows before financing activities
(1,832) 5,253 1,824
Employees (FTEs) 6,879 5,299 6,011
For a reconciliation to the most directly comparable US GAAP measures,
see the chapter Reconciliation of non-US GAAP information
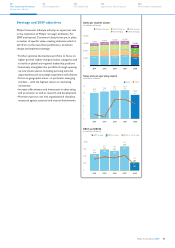
2008 financial performance
The sector Group Management & Services comprises
the activities of the corporate center including Philips’
global management and sustainability programs, as well
as country and regional overhead costs, and costs of
pension and other postretirement benefit plans.
Additionally, the global service units such as Philips
General Purchasing, real estate, and shared financial
services are reported in this sector.
In 2008, the EBITA of corporate & regional overheads
was EUR 15 million lower than 2007, mainly due to higher
restructuring charges.
Brand campaign investments in 2008 were EUR 47 million
lower than 2007 due to lower spending and higher cost
reduction initiatives.
The EBITA of service units, pensions, and other was
impacted by a EUR 239 million asbestos-related settlement
charge and higher restructuring costs. Pension and other
postretirement benefit costs were in line with 2007.
Cash flows before financing activities resulted in a
EUR 1,824 million inflow in 2008, compared to an
inflow of EUR 5,253 million in 2007. 2008 included
cash receipts related to the sale of shares in TSMC
(EUR 1,831 million) and LG Display (EUR 670 million)
whereas 2007 saw EUR 5.4 billion of cash proceeds
from the sale of TSMC and LG Display.
Group
Management
& Services
Philips Annual Report 2008 93
122
Performance statements
114
Supervisory Board report
110
Our leadership
94
Risk management
70
Our sector performance
Group Management
& Services