Philips 2008 Annual Report Download - page 82
Download and view the complete annual report
Please find page 82 of the 2008 Philips annual report below. You can navigate through the pages in the report by either clicking on the pages listed below, or by using the keyword search tool below to find specific information within the annual report.-
 1
1 -
2
-
3
-
4
-
5
-
6
-
7
-
8
-
9
-
10
-
11
-
12
-
13
-
14
-
15
-
16
-
17
-
18
-
19
-
20
-
21
-
22
-
23
-
24
-
25
-
26
-
27
-
28
-
29
-
30
-
31
-
32
-
33
-
34
-
35
-
36
-
37
-
38
-
39
-
40
-
41
-
42
-
43
-
44
-
45
-
46
-
47
-
48
-
49
-
50
-
51
-
52
-
53
-
54
-
55
-
56
-
57
-
58
-
59
-
60
-
61
-
62
-
63
-
64
-
65
-
66
-
67
-
68
-
69
-
70
-
71
-
 72
72 -
 73
73 -
 74
74 -
 75
75 -
 76
76 -
 77
77 -
 78
78 -
 79
79 -
 80
80 -
 81
81 -
 82
82 -
 83
83 -
 84
84 -
 85
85 -
 86
86 -
 87
87 -
 88
88 -
 89
89 -
 90
90 -
 91
91 -
 92
92 -
93
-
94
-
95
-
96
-
97
-
98
-
99
-
100
-
101
-
102
-
103
-
104
-
105
-
106
-
107
-
108
-
109
-
110
-
111
-
112
-
113
-
114
-
115
-
116
-
117
-
118
-
119
-
120
-
121
-
122
-
123
-
124
-
125
-
126
-
127
-
128
-
129
-
130
-
131
-
132
-
133
-
134
-
135
-
136
-
137
-
138
-
139
-
140
-
141
-
142
-
143
-
144
-
145
-
146
-
147
-
148
-
149
-
150
-
151
-
152
-
153
-
154
-
155
-
156
-
157
-
158
-
159
-
160
-
161
-
162
-
163
-
164
-
165
-
166
-
167
-
168
-
169
-
170
-
171
-
172
-
173
-
174
-
175
-
176
-
177
-
178
-
179
-
180
-
181
-
182
-
183
-
184
-
185
-
186
-
187
-
188
-
189
-
190
-
191
-
192
-
193
-
194
-
195
-
196
-
197
-
198
-
199
-
200
-
201
-
202
-
203
-
204
-
205
-
206
-
207
-
208
-
209
-
210
-
211
-
212
-
213
-
214
-
215
-
216
-
217
-
218
-
219
-
220
-
221
-
222
-
223
-
224
-
225
-
226
-
227
-
228
-
229
-
230
-
231
-
232
-
233
-
234
-
235
-
236
-
237
-
238
-
239
-
240
-
241
-
242
-
243
-
244
-
245
-
246
-
247
-
248
-
249
-
250
-
251
-
252
-
253
-
254
-
255
-
256
-
257
-
258
-
259
-
260
-
261
-
262
-
263
-
264
-
265
-
266
-
267
-
268
-
269
-
270
-
271
-
272
-
273
-
274
-
275
-
276
 |
 |

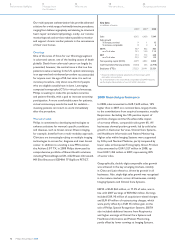
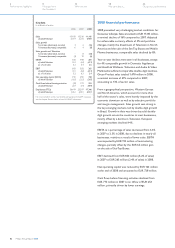
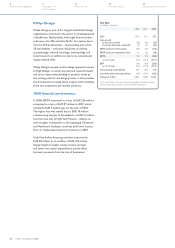
Key data
in millions of euros
2006 2007 2008
Sales 13,108 13,330 11,145
of which Television 6,559 6,270 4,980
Sales growth
% increase (decrease), nominal 42(16)
% increase (decrease), comparable
64(8)
Sales growth excl. Television
% increase (decrease), nominal –8(13)
% increase (decrease), comparable
(3) 10 (6)
EBITA 692 848 281
of which Television 155 (68) (413)
as a % of sales 5.3 6.4 2.5
EBIT 683 832 265
of which Television 155 (68) (413)
as a % of sales 5.2 6.2 2.4
Net operating capital (NOC) 910 890 728
of which Television (185) (255) (245)
Cash flows before financing activities
(39) 772 253
of which Television 207 (41) (489)
Employees (FTEs) 24,419 23,397 17,346
of which Television 7,262 6,855 4,943
For a reconciliation to the most directly comparable US GAAP measures,
see the chapter Reconciliation of non-US GAAP information
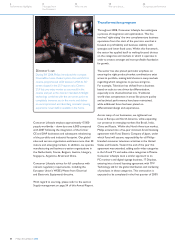
2008 financial performance
2008 presented very challenging market conditions for
Consumer Lifestyle. Sales amounted to EUR 11,145 million,
a nominal decline of 16% compared to 2007. Adjusted
for unfavorable currency effects of 3% and portfolio
changes, mainly the divestment of Television in North
America and the sale of the Set-Top Boxes and Mobile
Phones businesses, comparable sales declined by 8%.
Year-on-year declines were seen in all businesses, except
for 4% comparable growth in Domestic Appliances
and Health & Wellness. Television and Audio & Video
Multimedia suffered comparable double-digit declines.
Green Product sales totaled 1,478 million in 2008,
a nominal increase of 41% compared to 2007,
amounting to 13% of sector sales.
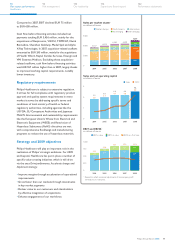
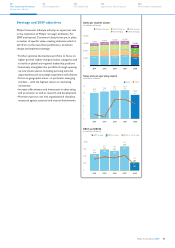
From a geographical perspective, Western Europe
and North America, which account for more than
half of the sector’s sales, were heavily impacted by the
economic downturn as well as by selective portfolio
and margin management. Sales growth was strong in
the key emerging markets, led by double-digit growth
in Brazil. Growth in Asia was driven by solid double-
digit growth across the countries in most businesses,
mostly offset by a decline in Television. European
emerging markets declined 14%.
EBITA as a percentage of sales decreased from 6.4%
in 2007 to 2.5% in 2008, due to declines in nearly all
businesses, mainly as a result of lower sales. EBITA
was impacted by EUR 195 million of restructuring
charges, partially offset by the EUR 63 million gain
on the sale of Set-Top Boxes.
EBIT declined from EUR 832 million (6.2% of sales)
in 2007 to EUR 265 million (2.4% of sales) in 2008.
Net operating capital was reduced by EUR 162 million
at the end of 2008 and amounted to EUR 728 million.
Cash flows before financing activities declined from
EUR 772 million in 2007 to an inflow of EUR 253
million, primarily driven by lower earnings.
Philips Annual Report 200882
42
Our group performance
18
We care about...
8
Message from
the President
6
Performance highlights
14
Who we are