Philips 2008 Annual Report Download - page 59
Download and view the complete annual report
Please find page 59 of the 2008 Philips annual report below. You can navigate through the pages in the report by either clicking on the pages listed below, or by using the keyword search tool below to find specific information within the annual report.-
 1
1 -
2
-
3
-
4
-
5
-
6
-
7
-
8
-
9
-
10
-
11
-
12
-
13
-
14
-
15
-
16
-
17
-
18
-
19
-
20
-
21
-
22
-
23
-
24
-
25
-
26
-
27
-
28
-
29
-
30
-
31
-
32
-
33
-
34
-
35
-
36
-
37
-
38
-
39
-
40
-
41
-
42
-
43
-
44
-
45
-
46
-
47
-
48
-
 49
49 -
 50
50 -
 51
51 -
 52
52 -
 53
53 -
 54
54 -
 55
55 -
 56
56 -
 57
57 -
 58
58 -
 59
59 -
 60
60 -
 61
61 -
 62
62 -
 63
63 -
 64
64 -
 65
65 -
 66
66 -
 67
67 -
 68
68 -
 69
69 -
70
-
71
-
72
-
73
-
74
-
75
-
76
-
77
-
78
-
79
-
80
-
81
-
82
-
83
-
84
-
85
-
86
-
87
-
88
-
89
-
90
-
91
-
92
-
93
-
94
-
95
-
96
-
97
-
98
-
99
-
100
-
101
-
102
-
103
-
104
-
105
-
106
-
107
-
108
-
109
-
110
-
111
-
112
-
113
-
114
-
115
-
116
-
117
-
118
-
119
-
120
-
121
-
122
-
123
-
124
-
125
-
126
-
127
-
128
-
129
-
130
-
131
-
132
-
133
-
134
-
135
-
136
-
137
-
138
-
139
-
140
-
141
-
142
-
143
-
144
-
145
-
146
-
147
-
148
-
149
-
150
-
151
-
152
-
153
-
154
-
155
-
156
-
157
-
158
-
159
-
160
-
161
-
162
-
163
-
164
-
165
-
166
-
167
-
168
-
169
-
170
-
171
-
172
-
173
-
174
-
175
-
176
-
177
-
178
-
179
-
180
-
181
-
182
-
183
-
184
-
185
-
186
-
187
-
188
-
189
-
190
-
191
-
192
-
193
-
194
-
195
-
196
-
197
-
198
-
199
-
200
-
201
-
202
-
203
-
204
-
205
-
206
-
207
-
208
-
209
-
210
-
211
-
212
-
213
-
214
-
215
-
216
-
217
-
218
-
219
-
220
-
221
-
222
-
223
-
224
-
225
-
226
-
227
-
228
-
229
-
230
-
231
-
232
-
233
-
234
-
235
-
236
-
237
-
238
-
239
-
240
-
241
-
242
-
243
-
244
-
245
-
246
-
247
-
248
-
249
-
250
-
251
-
252
-
253
-
254
-
255
-
256
-
257
-
258
-
259
-
260
-
261
-
262
-
263
-
264
-
265
-
266
-
267
-
268
-
269
-
270
-
271
-
272
-
273
-
274
-
275
-
276
 |
 |

Stockholders’ equity
Stockholders’ equity declined by EUR 5,399 million in
2008 to EUR 16,243 million at December 31, 2008.
The decrease was mainly attributable to share repurchase
programs for capital reduction purposes, as well as the
hedging of long-term incentive and employee stock
purchase programs, reducing equity by EUR 3,298
million. The dividend payment to shareholders in 2008
further reduced equity by EUR 720 million. Additionally
a EUR 1,539 million decrease related to total changes
in comprehensive income, net of tax. The decrease
was partially offset by EUR 158 million related to
re-issuance of treasury stock and share-based
compensation plans.
Stockholder’s equity decreased by EUR 1,321 million
in 2007 to EUR 21,642 million at December 31, 2007.
Share repurchase programs for capital reduction
purposes and the hedging of long-term incentive
and employee stock purchase programs resulted in
a EUR 1,633 million reduction of equity. The dividend
payment to shareholders in 2007 further reduced
equity by EUR 659 million. The decrease was partially
offset by EUR 305 million related to re-issuance of
treasury stock and share-based compensation plans
and a further EUR 666 million increase, related to
total changes in comprehensive income, net of tax.
The number of outstanding common shares of
Royal Philips Electronics at December 31, 2008,
was 923 million (2007: 1,065 million).
At the end of 2008, the Company held 47.6 million shares
in treasury to cover the future delivery of shares. This
was in connection with the 65.5 million rights outstanding
at the end of 2008 under the Company’s long-term
incentive plan and convertible personnel debentures.
At the end of 2008, the Company held 1.9 million
shares for cancellation.
At the end of 2007, the Company held 52.1 million
shares in treasury to cover the future delivery of
shares. This was in connection with the 61.4 million
rights outstanding at year-end 2007 under the Company’s
long-term incentive plans and convertible personnel
debentures. At the end of 2007, the Company held
25.8 million shares for cancellation. Treasury shares
are accounted for as a reduction of stockholders’ equity.
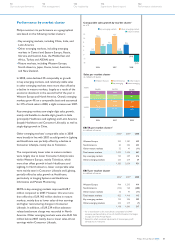
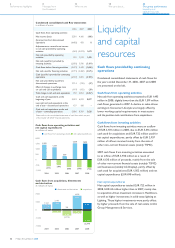
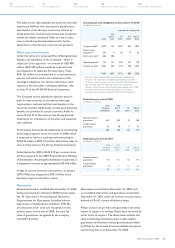
Liquidity position
Including the company’s net debt (cash) position (cash
and cash equivalents, net of debt), listed available for-sale
securities, listed equity-accounted investees,
as well as
its USD 2.5 billion commercial paper program supported
by the revolving credit facility, the company
had access
to net available liquidity resources of EUR 2,395 million
as of December 31, 2008, compared to EUR 11,374
million one year earlier.
The fair value of the Company’s listed available-for-
sale securities, based on quoted market prices at
December 31, 2008, amounted to EUR 599 million,
of which EUR 558 million related to LG Display and
EUR 29 million related to Pace Micro Technology.
Liquidity position
in millions of euros
2006 2007 2008
Cash and cash equivalents 5,886 8,769 3,620
Trading securities 192 −−
Commited revolving credit facility
/ CP program 1,898 1,698 2,274
Short-term debt (863) (2,345) (717)
Short-term available liquidity 7,113 8,122 5,177
Available-for-sale securities at
market value 6,529 1,776 599
Main listed investments in equity-
accounted investees at market value
2,803 2,688 60
Long-term debt (3,006) (1,212) (3,441)
Net available liquidity resources 13,439 11,374 2,395
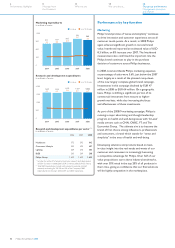
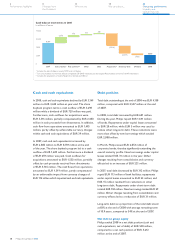
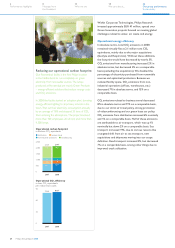
Net debt (cash) to group equity2)
in billions of euros
■ net debt (cash) ■ group equity
1)
25
20
15
10
5
0
(5)
(10)
0.3
14.9
2 : 98
2004
(0.7)
16.7
(4) : 104
2005
(2)
23
(10) : 110
2006
(5.2)
21.7
(32) : 132
2007
0.5
16.3
3 : 97
2008
ratio:
Stockholders’ equity and minority interests
1)
For a reconciliation to the most directly comparable US GAAP
2)
measures, see the chapter Reconciliation of non-US GAAP information
Philips Annual Report 2008 59
122
Performance statements
114
Supervisory Board report
110
Our leadership
94
Risk management
70
Our sector performance