Philips 2008 Annual Report Download - page 154
Download and view the complete annual report
Please find page 154 of the 2008 Philips annual report below. You can navigate through the pages in the report by either clicking on the pages listed below, or by using the keyword search tool below to find specific information within the annual report.-
 1
1 -
2
-
3
-
4
-
5
-
6
-
7
-
8
-
9
-
10
-
11
-
12
-
13
-
14
-
15
-
16
-
17
-
18
-
19
-
20
-
21
-
22
-
23
-
24
-
25
-
26
-
27
-
28
-
29
-
30
-
31
-
32
-
33
-
34
-
35
-
36
-
37
-
38
-
39
-
40
-
41
-
42
-
43
-
44
-
45
-
46
-
47
-
48
-
49
-
50
-
51
-
52
-
53
-
54
-
55
-
56
-
57
-
58
-
59
-
60
-
61
-
62
-
63
-
64
-
65
-
66
-
67
-
68
-
69
-
70
-
71
-
72
-
73
-
74
-
75
-
76
-
77
-
78
-
79
-
80
-
81
-
82
-
83
-
84
-
85
-
86
-
87
-
88
-
89
-
90
-
91
-
92
-
93
-
94
-
95
-
96
-
97
-
98
-
99
-
100
-
101
-
102
-
103
-
104
-
105
-
106
-
107
-
108
-
109
-
110
-
111
-
112
-
113
-
114
-
115
-
116
-
117
-
118
-
119
-
120
-
121
-
122
-
123
-
124
-
125
-
126
-
127
-
128
-
129
-
130
-
131
-
132
-
133
-
134
-
135
-
136
-
137
-
138
-
139
-
140
-
141
-
142
-
143
-
 144
144 -
 145
145 -
 146
146 -
 147
147 -
 148
148 -
 149
149 -
 150
150 -
 151
151 -
 152
152 -
 153
153 -
 154
154 -
 155
155 -
 156
156 -
 157
157 -
 158
158 -
 159
159 -
 160
160 -
 161
161 -
 162
162 -
 163
163 -
 164
164 -
165
-
166
-
167
-
168
-
169
-
170
-
171
-
172
-
173
-
174
-
175
-
176
-
177
-
178
-
179
-
180
-
181
-
182
-
183
-
184
-
185
-
186
-
187
-
188
-
189
-
190
-
191
-
192
-
193
-
194
-
195
-
196
-
197
-
198
-
199
-
200
-
201
-
202
-
203
-
204
-
205
-
206
-
207
-
208
-
209
-
210
-
211
-
212
-
213
-
214
-
215
-
216
-
217
-
218
-
219
-
220
-
221
-
222
-
223
-
224
-
225
-
226
-
227
-
228
-
229
-
230
-
231
-
232
-
233
-
234
-
235
-
236
-
237
-
238
-
239
-
240
-
241
-
242
-
243
-
244
-
245
-
246
-
247
-
248
-
249
-
250
-
251
-
252
-
253
-
254
-
255
-
256
-
257
-
258
-
259
-
260
-
261
-
262
-
263
-
264
-
265
-
266
-
267
-
268
-
269
-
270
-
271
-
272
-
273
-
274
-
275
-
276
 |
 |

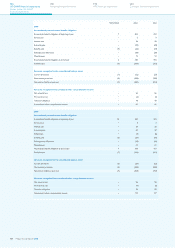
At the end of February 2008, Philips’ influence on LG Display’s
operating and financial policies including representation on the LG
Display board was reduced. Consequently, the 19.9% investment in
LG Display was transferred from Investments in equity-accounted
investees to Other non-current financial assets effective March 1, 2008,
as Philips was no longer able to exercise significant influence. Philips
ceased to apply equity accounting for its LG Display shares as of
that date.
Results on sales of shares
2006 2007 2008
FEI Company 76 −−
LG Display −508 −
Others 3 6 (2)
79 514 (2)
2007
In 2007, Philips sold 46,400,000 shares of LG Display common stock,
resulting in a gain of EUR 508 million. As a result of the sale, Philips’
shareholding in LG Display was reduced from 32.9% to 19.9%.
2006
In 2006, Philips sold its interest of 24.8% in FEI Company (see note 2).
Investment impairment/other charges
2006 2007 2008
LG.Philips Displays (61) (22) (9)
Others (9) −(63)
(70) (22) (72)
2008
The category ‘Others’ includes an impairment charge related to our
12.4% interest in TPV. Philips performed impairment reviews on the
book value of the investment in TPV in 2008. We concluded that an
impairment charge of EUR 59 million was required. The impairment
reviews in 2008 were triggered by the deteriorating economic
environment of the flat panel industry, the weakening financial
performance of TPV and the stock price performance of TPV. The
valuation of TPV is based on level 1 of the fair value hierarchy. The
valuation as per December 31, 2008 was based on the stock price
of TPV as of that date on the Hong Kong Stock Exchange.
2007
The voluntary support of social plans for employees impacted by
the bankruptcy of certain LG.Philips Displays activities amounted
to EUR 22 million.
2006
The voluntary support of social plans for employees impacted by the
bankruptcy of certain LG.Philips Displays activities amounted to EUR
61 million.
Investments in equity-accounted investees
Investment in equity-accounted investees as of
January 1, 2008 1,886
Changes:
Acquisitions/additions 56
Sales/repayments (3)
Transfer to other non-current financial assets (1,601)
Share in income/value adjustments 30
Dividends received (65)
Translation and exchange rate differences (19)
Investments in equity-accounted investees
as of December 31, 2008 284
The EUR 1,601 million reported on Transfer to other non-current
financial assets relates to the investment in LG Display.
Included in investments is EUR 25 million (2007: EUR 404 million),
representing the excess of the Company’s investment over its
underlying equity in the net assets of equity-accounted investees.
The total carrying value of investments in, and loans to, equity-
accounted investees is summarized as follows:
2007 2008
share-
holding % amount
share-
holding % amount
LG Display 19.9 1,607 −−
Other equity-accounted
investees 279 284
1,886 284
The category Other equity-accounted investees includes the investment
in TPV (12.4%, carrying value EUR 60 million) and InterTrust
Technologies Corporation (49.5%, carrying value EUR 64 million).
The Company owns TPV bonds that have convertible rights, that
potentially could result in significant influence.
The investment in equity-accounted investees are mainly included in
the sector Group Management & Services.
Summarized information of equity-accounted investees
Summarized financial information on the Company’s investments in
equity-accounted investees, on a combined basis, is presented below:
2006 2007 2008
Net sales 13,599 15,799 6,951
Income (loss) before taxes (626) 1,304 538
Income taxes 187 (169) (109)
Other income (loss) (36) (1) −
Net income (loss) (475) 1,134 429
Total share in net income (loss) of
equity-accounted investees recognized
in the consolidated statements of
income (180) 271 81
December 31
2007 2008
Current assets 6,380 2,781
Non-current assets 6,406 685
12,786 3,466
Current liabilities (3,340) (2,134)
Non-current liabilities (2,429) (184)
Net asset value 7,017 1,148
Investments in equity-accounted investees included
in the consolidated balance sheet 1,886 284
Philips Annual Report 2008154
180
Sustainability performance
192
IFRS financial statements
244
Company financial statements
124
US GAAP financial statements
Notes to the US GAAP
financial statements