Philips 2008 Annual Report Download - page 241
Download and view the complete annual report
Please find page 241 of the 2008 Philips annual report below. You can navigate through the pages in the report by either clicking on the pages listed below, or by using the keyword search tool below to find specific information within the annual report.-
 1
1 -
2
-
3
-
4
-
5
-
6
-
7
-
8
-
9
-
10
-
11
-
12
-
13
-
14
-
15
-
16
-
17
-
18
-
19
-
20
-
21
-
22
-
23
-
24
-
25
-
26
-
27
-
28
-
29
-
30
-
31
-
32
-
33
-
34
-
35
-
36
-
37
-
38
-
39
-
40
-
41
-
42
-
43
-
44
-
45
-
46
-
47
-
48
-
49
-
50
-
51
-
52
-
53
-
54
-
55
-
56
-
57
-
58
-
59
-
60
-
61
-
62
-
63
-
64
-
65
-
66
-
67
-
68
-
69
-
70
-
71
-
72
-
73
-
74
-
75
-
76
-
77
-
78
-
79
-
80
-
81
-
82
-
83
-
84
-
85
-
86
-
87
-
88
-
89
-
90
-
91
-
92
-
93
-
94
-
95
-
96
-
97
-
98
-
99
-
100
-
101
-
102
-
103
-
104
-
105
-
106
-
107
-
108
-
109
-
110
-
111
-
112
-
113
-
114
-
115
-
116
-
117
-
118
-
119
-
120
-
121
-
122
-
123
-
124
-
125
-
126
-
127
-
128
-
129
-
130
-
131
-
132
-
133
-
134
-
135
-
136
-
137
-
138
-
139
-
140
-
141
-
142
-
143
-
144
-
145
-
146
-
147
-
148
-
149
-
150
-
151
-
152
-
153
-
154
-
155
-
156
-
157
-
158
-
159
-
160
-
161
-
162
-
163
-
164
-
165
-
166
-
167
-
168
-
169
-
170
-
171
-
172
-
173
-
174
-
175
-
176
-
177
-
178
-
179
-
180
-
181
-
182
-
183
-
184
-
185
-
186
-
187
-
188
-
189
-
190
-
191
-
192
-
193
-
194
-
195
-
196
-
197
-
198
-
199
-
200
-
201
-
202
-
203
-
204
-
205
-
206
-
207
-
208
-
209
-
210
-
211
-
212
-
213
-
214
-
215
-
216
-
217
-
218
-
219
-
220
-
221
-
222
-
223
-
224
-
225
-
226
-
227
-
228
-
229
-
230
-
 231
231 -
 232
232 -
 233
233 -
 234
234 -
 235
235 -
 236
236 -
 237
237 -
 238
238 -
 239
239 -
 240
240 -
 241
241 -
 242
242 -
 243
243 -
 244
244 -
 245
245 -
 246
246 -
 247
247 -
 248
248 -
 249
249 -
 250
250 -
 251
251 -
252
-
253
-
254
-
255
-
256
-
257
-
258
-
259
-
260
-
261
-
262
-
263
-
264
-
265
-
266
-
267
-
268
-
269
-
270
-
271
-
272
-
273
-
274
-
275
-
276
 |
 |

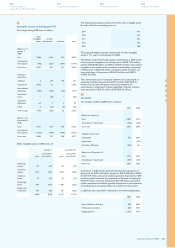
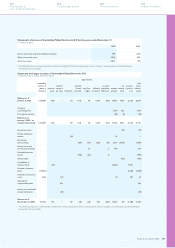
Any difference between the cost and the cash received at the time
treasury shares are issued, is recorded in capital in excess of par
value, except in the situation in which the cash received is lower than
cost and capital in excess of par has been depleted.
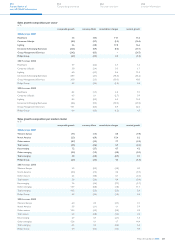
In order to reduce potential dilution effects, the following
transactions took place:
2007 2008
Shares acquired 27,326,969 273
Average market price EUR 29.65 EUR 24.61
Amount paid EUR 810 million −
Shares delivered 11,140,884 4,541,969
Average market price 30.46 EUR 23.44
Amount received EUR 199 million EUR 52 million
Total shares in treasury at
end of year 52,119,611 47,577,915
Total cost EUR 1,393 million EUR 1,263 million
In order to reduce share capital, the following transactions took place
in 2007 and 2008:
2007 2008
Shares acquired 25,813,898 146,453,094
Average market
price EUR 31.87 EUR 22.52
Amount paid EUR 823 million EUR 3,298 million
Reduction of capital
stock −170,414,994
Total shares in
treasury at year-end 25,813,898 1,851,998
Total cost EUR 823 million EUR 25 million
Net income (loss) and distribution from retained earnings
The net loss of 2008 will be accounted for in retained earnings. A
distribution from retained earnings of EUR 0.70 per common share
will be proposed to the 2009 Annual General Meeting of Shareholders.
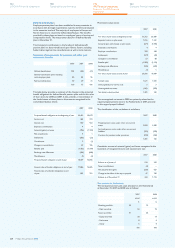
Limitations in the distribution of stockholders’ equity
Pursuant to Dutch law limitations exist relating to the distribution of
stockholders’ equity of EUR 1,296 million (2007: EUR 2,915 million).
Such limitations relate to common stock of EUR 194 million (2007:
EUR 228 million) as well as to legal reserves required by Dutch law
included under revaluation reserves of EUR 117 million (2007: EUR 133
million) and retained earnings of EUR 985 million (2007: EUR 1,343
million). In 2007 the limitations were also affected by unrealized gains
on available-for-sale securities (EUR 1,183 million) and cash flow
hedges (EUR 28 million), which were both included in other reserves.
In general, gains related to available-for-sale securities, cash flow
hedges and currency translation differences (which have been negative
for the last two years) reduce the distributable stockholders’ equity.
By their nature, losses relating to available-for-sale securities, cash
flow hedges and currency translation differences (as of December 31,
2008 an aggregated amount of EUR 709 million) automatically reduce
stockholders’ equity, and thereby distributable amounts.
The legal reserve required by Dutch law of EUR 985 million (2007:
EUR 1,343 million) included under retained earnings relates to
investments in affiliated companies.
Other reserves are composed of currency translation losses of
EUR 656 million (2007: losses of EUR 613 million), unrealized losses
on available-for-sales securities of EUR 25 million (2007: gains of
EUR 1,183 million), unrealized losses on cash flow hedges of EUR 28
million (2007: gains of EUR 28 million) and actuarial losses on pension
plans of EUR 1,209 million (2007: losses of EUR 305 million). The
movement in unrealized results on available-for-sales securities are
especially due to the sale of shares (TSMC and LG Display) and the
recognition of impairment charges (see note 48).
63
64
Cash from derivatives
The Company has no trading derivatives. A total of EUR 337 million
cash was received with respect to foreign exchange derivative contracts
related to financing of subsidiaries (2007: EUR 385 million; 2006: EUR
62 million). Cash flow from interest-related derivatives is part of cash
flow from operating activities. During 2008, there was a cash inflow in
relation to these derivatives of EUR 28 million (2007: EUR 2 million
cash outflow; 2006: EUR 1 million cash outflow).
65
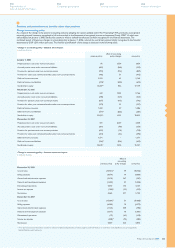
Proceeds from other non-current financial assets
In 2008, the sale of TSMC shares, LG Display shares, D&M and Pace
shares generated cash totaling EUR 2,553 million.
In 2007, the sale of TSMC shares, Nuance Communications shares
and JDS Uniphase shares generated cash totaling EUR 4,002 million.
In 2006, there were no material proceeds from the sale of other
non-current financial assets.
66
Assets received in lieu of cash from the sale
of businesses
In April 2008, the Company acquired 64.5 million shares in Pace
Micro Technology in exchange for the transfer of the Company’s
Set-Top Boxes and Connectivity Solutions activities which represented
a value of EUR 74 million at the date of the closing of that transaction.
In August 2008, Philips transferred its 69.5% ownership in MedQuist
to CBAY. A part of the consideration was settled through the
issuance of a convertible bond by CBAY which represented a fair
value of EUR 53 million at the date of the closing of the transaction.
In September 2008, Philips acquired a 33.5% interest in Prime
Technology Ventures III in exchange for the transfer of seven incubator
activities which represented a value of EUR 21 million at the date of
the closing of that transaction.
In 2007, the Company only received cash as consideration in connection
with the sale of businesses.
During 2006, several ownership interests were received in connection
with certain sale and transfer transactions.
During July 2006, Philips transferred its Optical Pick Up activities
to Arima Devices receiving a 12% interest in Arima Devices of
EUR 8 million.
In June 2006, the merger was completed of Philips Mobile Display
Systems with Toppoly Optoelectronics Corporation of Taiwan to
form a new company named TPO. Philips obtained a 17.5% stake in
TPO as a consideration for the transaction valued at EUR 180 million.
67
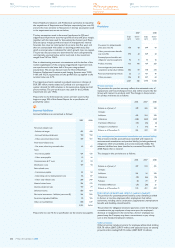
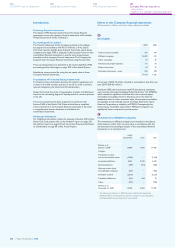
Related-party transactions
In the normal course of business, Philips purchases and sells goods
and services to various related parties in which Philips typically holds
a 50% or less equity interest and has significant influence. These
transactions are generally conducted with terms comparable to
transactions with third parties.
2006 2007 2008
Purchases of goods and services 2,041 1,837 692
Sales of goods and services 152 168 174
Receivables from related parties 37 26 24
Payables to related parties 271 289 112
For acquisitions and divestments see note 39.
For remuneration details of the members of the Board of
Management and the Supervisory Board see note 34.
For employee benefit plans see note 56.
64
65
66
67
Philips Annual Report 2008 241
254
Corporate governance
250
Reconciliation of
non-US GAAP information
262
Ten-year overview
266
Investor information