Philips 2008 Annual Report Download - page 55
Download and view the complete annual report
Please find page 55 of the 2008 Philips annual report below. You can navigate through the pages in the report by either clicking on the pages listed below, or by using the keyword search tool below to find specific information within the annual report.-
 1
1 -
2
-
3
-
4
-
5
-
6
-
7
-
8
-
9
-
10
-
11
-
12
-
13
-
14
-
15
-
16
-
17
-
18
-
19
-
20
-
21
-
22
-
23
-
24
-
25
-
26
-
27
-
28
-
29
-
30
-
31
-
32
-
33
-
34
-
35
-
36
-
37
-
38
-
39
-
40
-
41
-
42
-
43
-
44
-
 45
45 -
 46
46 -
 47
47 -
 48
48 -
 49
49 -
 50
50 -
 51
51 -
 52
52 -
 53
53 -
 54
54 -
 55
55 -
 56
56 -
 57
57 -
 58
58 -
 59
59 -
 60
60 -
 61
61 -
 62
62 -
 63
63 -
 64
64 -
 65
65 -
66
-
67
-
68
-
69
-
70
-
71
-
72
-
73
-
74
-
75
-
76
-
77
-
78
-
79
-
80
-
81
-
82
-
83
-
84
-
85
-
86
-
87
-
88
-
89
-
90
-
91
-
92
-
93
-
94
-
95
-
96
-
97
-
98
-
99
-
100
-
101
-
102
-
103
-
104
-
105
-
106
-
107
-
108
-
109
-
110
-
111
-
112
-
113
-
114
-
115
-
116
-
117
-
118
-
119
-
120
-
121
-
122
-
123
-
124
-
125
-
126
-
127
-
128
-
129
-
130
-
131
-
132
-
133
-
134
-
135
-
136
-
137
-
138
-
139
-
140
-
141
-
142
-
143
-
144
-
145
-
146
-
147
-
148
-
149
-
150
-
151
-
152
-
153
-
154
-
155
-
156
-
157
-
158
-
159
-
160
-
161
-
162
-
163
-
164
-
165
-
166
-
167
-
168
-
169
-
170
-
171
-
172
-
173
-
174
-
175
-
176
-
177
-
178
-
179
-
180
-
181
-
182
-
183
-
184
-
185
-
186
-
187
-
188
-
189
-
190
-
191
-
192
-
193
-
194
-
195
-
196
-
197
-
198
-
199
-
200
-
201
-
202
-
203
-
204
-
205
-
206
-
207
-
208
-
209
-
210
-
211
-
212
-
213
-
214
-
215
-
216
-
217
-
218
-
219
-
220
-
221
-
222
-
223
-
224
-
225
-
226
-
227
-
228
-
229
-
230
-
231
-
232
-
233
-
234
-
235
-
236
-
237
-
238
-
239
-
240
-
241
-
242
-
243
-
244
-
245
-
246
-
247
-
248
-
249
-
250
-
251
-
252
-
253
-
254
-
255
-
256
-
257
-
258
-
259
-
260
-
261
-
262
-
263
-
264
-
265
-
266
-
267
-
268
-
269
-
270
-
271
-
272
-
273
-
274
-
275
-
276
 |
 |

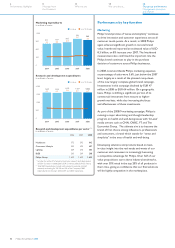
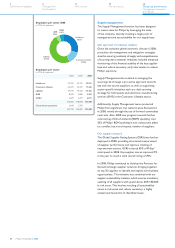
Employment
Excluding discontinued operations (MedQuist in 2007),
the total number of employees of the Philips Group
was 121,398 at the end of 2008, compared to 118,098
at the end of 2007. Approximately 47% were employed
in the Lighting sector, due to the still relatively strong
vertical integration in this business. Some 29% were
employed in the Healthcare sector and approximately
14% of the workforce was employed in the Consumer
Lifestyle sector.
The main increase in employee numbers in 2008 was
due to acquisitions, which added 12,673 employees.
The main acquisition-related increases were within
Healthcare (mainly Respironics) and Lighting (Genlyte).
This increase was partially reduced by the divestments
in Consumer Lifestyle, primarily the North America
television activities and the sale of Set-Top Boxes.
Additionally, restructuring and business optimization
projects resulted in personnel reductions across all
sectors, mainly within Consumer Lifestyle and Lighting.
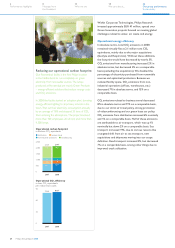
Approximately 58% of Philips’ workforce is located
in mature markets, with 42% in emerging markets.
In 2008, the number of employees in mature markets
increased, largely as a result of the Genlyte and
Respironics acquisitions. This increase was partly
offset by restructuring programs across all sectors.
Key emerging markets saw a reduction in employee
numbers as additional headcount from the Healthcare
acquisitions in China, India and Brazil was offset by the
divestment of HTP Optics, the sale of the Television
factory in Juarez (Mexico) and a reduction of employees
due to lower factory production. The employee
decrease in other emerging markets was largely due
to low year-end production volumes in Hungary and
the Lamps and Lighting Electronics factory in Poland.
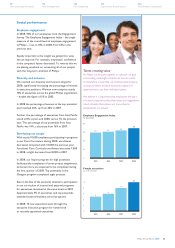
Sales per employee decreased from EUR 224,000
in 2007 to EUR 209,000 in 2008, affected by 3%
unfavorable currency movements compared to 2007.
Adjusted for the 3% adverse foreign currency impact
in 2008, sales per employee declined 4%, largely due
to Consumer Lifestyle, caused by a sharp decline in
sales in the second half of the year, as well as
Healthcare and Innovation & Emerging Businesses.
The decline was partly mitigated by increases in
Lighting and Group Management & Services.
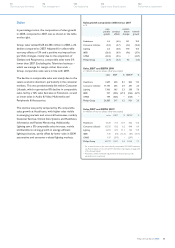
Employees per market cluster
in FTEs at year-end
2006 2007 2008
Western Europe 39,722 40,244 37,452
North America 22,169 21,682 31,336
Other mature markets 1,831 1,850 1,633
Total mature markets 63,722 63,776 70,421
Key emerging markets 31,893 33,377 32,084
Other emerging markets 19,477 20,945 18,893
115,092 118,098 121,398
Discontinued operations 6,640 5,703 −
121,732 123,801 121,398
Employment
in FTEs
2006 2007 2008
Position at beginning of year 159,226 121,732 123,801
Consolidation changes:
- new consolidations 4,834 6,654 12,673
- deconsolidations (44,085) (3,535) (1,571)
Comparable change 1,757 (1,050) (13,505)
Position at year-end 121,732 123,801 121,398
of which:
continuing operations 115,092 118,098 121,398
discontinued operations 6,640 5,703 −
Average sales per employee1)
in thousands of euros
250
200
150
100
50
0
201
2004
219
2005
228
2006
224
2007
209
2008
Annual sales divided by the monthly average number of FTEs.
1)
Philips Annual Report 2008 55
122
Performance statements
114
Supervisory Board report
110
Our leadership
94
Risk management
70
Our sector performance