BB&T 2010 Annual Report Download - page 101
Download and view the complete annual report
Please find page 101 of the 2010 BB&T annual report below. You can navigate through the pages in the report by either clicking on the pages listed below, or by using the keyword search tool below to find specific information within the annual report.-
 1
1 -
2
-
3
-
4
-
5
-
6
-
7
-
8
-
9
-
10
-
11
-
12
-
13
-
14
-
15
-
16
-
17
-
18
-
19
-
20
-
21
-
22
-
23
-
24
-
25
-
26
-
27
-
28
-
29
-
30
-
31
-
32
-
33
-
34
-
35
-
36
-
37
-
38
-
39
-
40
-
41
-
42
-
43
-
44
-
45
-
46
-
47
-
48
-
49
-
50
-
51
-
52
-
53
-
54
-
55
-
56
-
57
-
58
-
59
-
60
-
61
-
62
-
63
-
64
-
65
-
66
-
67
-
68
-
69
-
70
-
71
-
72
-
73
-
74
-
75
-
76
-
77
-
78
-
79
-
80
-
81
-
82
-
83
-
84
-
85
-
86
-
87
-
88
-
89
-
90
-
 91
91 -
 92
92 -
 93
93 -
 94
94 -
 95
95 -
 96
96 -
 97
97 -
 98
98 -
 99
99 -
 100
100 -
 101
101 -
 102
102 -
 103
103 -
 104
104 -
 105
105 -
 106
106 -
 107
107 -
 108
108 -
 109
109 -
 110
110 -
 111
111 -
112
-
113
-
114
-
115
-
116
-
117
-
118
-
119
-
120
-
121
-
122
-
123
-
124
-
125
-
126
-
127
-
128
-
129
-
130
-
131
-
132
-
133
-
134
-
135
-
136
-
137
-
138
-
139
-
140
-
141
-
142
-
143
-
144
-
145
-
146
-
147
-
148
-
149
-
150
-
151
-
152
-
153
-
154
-
155
-
156
-
157
-
158
-
159
-
160
-
161
-
162
-
163
-
164
-
165
-
166
-
167
-
168
-
169
-
170
-
171
-
172
-
173
-
174
-
175
-
176
-
177
-
178
-
179
-
180
-
181
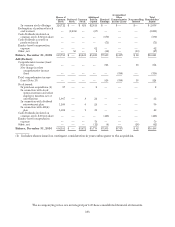
 |
 |

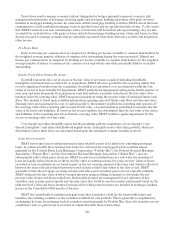
Shares of
Common
Stock Preferred
Stock Common
Stock
Additional
Paid-In
Capital Retained
Earnings
Accumulated
Other
Comprehensive
Income (Loss) Noncontrolling
Interest
Total
Shareholders’
Equity
In common stock offerings 124,712 $ — $ 624 $2,014 $ — $ — $— $ 2,638
Redemption of preferred stock
and warrant — (3,134) — (67) — — — (3,201)
Cash dividends declared on
common stock, $.92 per share — — — — (570) — — (570)
Cash dividends accrued on
preferred stock — — — — (73) — — (73)
Equity-based compensation
expense — — — 62 — — — 62
Other, net — 52 — 1 (52) — (18) (17)
Balance, December 31, 2009 689,750 $ — $3,449 $5,620 $7,539 $(417) $ 50 $16,241
Add (Deduct):
Comprehensive income (loss):
Net income — — — — 816 — 38 854
Net change in other
comprehensive income
(loss) — — — — — (330) — (330)
Total comprehensive income
(loss) (Note 13) — — — — 816 (330) 38 524
Stock issued:
In purchase acquisitions (1) 57 — — 2 — — — 2
In connection with stock
option exercises and other
employee benefits, net of
cancellations 1,667 — 8 24 — — — 32
In connection with dividend
reinvestment plan 1,106 — 6 24 — — — 30
In connection with 401(k)
plan 1,801 — 9 39 — — — 48
Cash dividends declared on
common stock, $.60 per share — — — — (416) — — (416)
Equity-based compensation
expense — — — 79 — — — 79
Other, net — — — (12) (4) — (26) (42)
Balance, December 31, 2010 694,381 $ — $3,472 $5,776 $7,935 $(747) $ 62 $16,498
(1) Includes shares issued as contingent consideration in years subsequent to the acquisition.
The accompanying notes are an integral part of these consolidated financial statements.
101