BB&T 2010 Annual Report Download - page 85
Download and view the complete annual report
Please find page 85 of the 2010 BB&T annual report below. You can navigate through the pages in the report by either clicking on the pages listed below, or by using the keyword search tool below to find specific information within the annual report.-
 1
1 -
2
-
3
-
4
-
5
-
6
-
7
-
8
-
9
-
10
-
11
-
12
-
13
-
14
-
15
-
16
-
17
-
18
-
19
-
20
-
21
-
22
-
23
-
24
-
25
-
26
-
27
-
28
-
29
-
30
-
31
-
32
-
33
-
34
-
35
-
36
-
37
-
38
-
39
-
40
-
41
-
42
-
43
-
44
-
45
-
46
-
47
-
48
-
49
-
50
-
51
-
52
-
53
-
54
-
55
-
56
-
57
-
58
-
59
-
60
-
61
-
62
-
63
-
64
-
65
-
66
-
67
-
68
-
69
-
70
-
71
-
72
-
73
-
74
-
 75
75 -
 76
76 -
 77
77 -
 78
78 -
 79
79 -
 80
80 -
 81
81 -
 82
82 -
 83
83 -
 84
84 -
 85
85 -
 86
86 -
 87
87 -
 88
88 -
 89
89 -
 90
90 -
 91
91 -
 92
92 -
 93
93 -
 94
94 -
 95
95 -
96
-
97
-
98
-
99
-
100
-
101
-
102
-
103
-
104
-
105
-
106
-
107
-
108
-
109
-
110
-
111
-
112
-
113
-
114
-
115
-
116
-
117
-
118
-
119
-
120
-
121
-
122
-
123
-
124
-
125
-
126
-
127
-
128
-
129
-
130
-
131
-
132
-
133
-
134
-
135
-
136
-
137
-
138
-
139
-
140
-
141
-
142
-
143
-
144
-
145
-
146
-
147
-
148
-
149
-
150
-
151
-
152
-
153
-
154
-
155
-
156
-
157
-
158
-
159
-
160
-
161
-
162
-
163
-
164
-
165
-
166
-
167
-
168
-
169
-
170
-
171
-
172
-
173
-
174
-
175
-
176
-
177
-
178
-
179
-
180
-
181
 |
 |
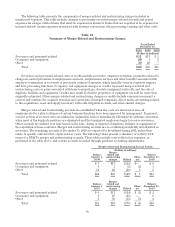
BB&T’s comprehensive risk profile, preserve a sufficient capital base from which to support future growth,
provide a competitive return to shareholders, comply with regulatory standards and achieve optimal credit
ratings for BB&T and its subsidiaries.
Management regularly monitors the capital position of BB&T on a consolidated basis. In this regard,
management’s overriding policy is to maintain capital at levels that will result in BB&T being classified as “well-
capitalized” for regulatory purposes and to maintain sufficient capital relative to the Corporation’s level of risk.
Secondarily, it is management’s intent to maintain consolidated capital levels that result in regulatory risk-based
capital ratios that are generally comparable with BB&T’s peers of similar size, complexity and risk profile.
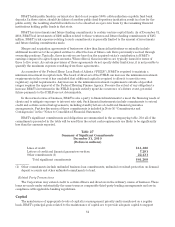
Management particularly monitors and intends to maintain the following minimum capital ratios:
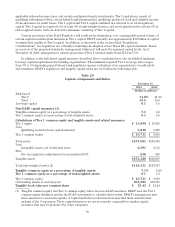
Table 28
BB&T’s Internal Capital Guidelines
Tier 1 Capital Ratio 8.50%
Total Capital Ratio 12.00%
Tier 1 Leverage Capital Ratio 7.00%
Tangible Capital Ratio 5.50%
Tier 1 Common Equity Ratio 7.00%
Payments of cash dividends to BB&T’s shareholders and repurchases of common shares are the methods used
to manage any excess capital generated. In addition, management closely monitors the Parent Company’s double
leverage ratio (investments in subsidiaries as a percentage of shareholders’ equity) with the intention of maintaining
the ratio below 125.0%. The active management of the subsidiaries’ equity capital, as described above, is the process
used to manage this important driver of Parent Company liquidity and is a key element in the management of
BB&T’s capital position.
The capital of BB&T’s subsidiaries is regularly monitored to determine if the levels that management
believes are the most beneficial and efficient for their operations are maintained. Management intends to
maintain capital at Branch Bank and BB&T FSB at levels that will result in these subsidiaries being classified as
“well-capitalized” for regulatory purposes. Secondarily, it is management’s intent to maintain Branch Bank’s
capital at levels that result in regulatory risk-based capital ratios that are generally comparable with peers of
similar size, complexity and risk profile. If the capital levels of Branch Bank increase above these guidelines,
excess capital may be transferred to the Parent Company, subject to regulatory and other operating
considerations, in the form of special dividend payments.
While nonrecurring events or management decisions may result in the Corporation temporarily falling below
its minimum guidelines for one or more of these ratios, it is management’s intent through capital planning to
return to these targeted minimums within a reasonable period of time. Such temporary decreases below these
minimums are not considered an infringement of BB&T’s overall capital policy provided the Corporation and
Branch Bank remain “well-capitalized.”
Capital Adequacy and Resources
Financial holding companies and their banking subsidiaries are subject to regulatory requirements with respect
to risk-based capital adequacy. Capital adequacy is an important indicator of financial stability and performance.
Risk-based capital ratios measure capital as a percentage of a combination of risk-weighted balance sheet
and off-balance sheet risk. The risk-weighted values of both balance sheet and off-balance sheet items are
determined in accordance with risk factors specified by Federal bank regulatory pronouncements. As of
December 31, 2010, federal bank regulators did not prescribe measures of tangible capital and, therefore, these
measures were considered non-GAAP. BB&T uses the Tier 1 common equity definition used in the SCAP
assessment to calculate measures of tangible capital and Tier 1 common capital. BB&T’s management uses these
measures to assess the quality of capital and believes that investors may find them useful in their analysis of the
Corporation. These capital measures are not necessarily comparable to similar capital measures that may be
presented by other companies.
Tier 1 capital is calculated as common shareholders’ equity, excluding the over- or underfunded status of
postretirement benefit obligations, unrealized gains or losses on debt securities available for sale, unrealized
gains on equity securities available for sale and unrealized gains or losses on cash flow hedges, net of deferred
income taxes; plus certain mandatorily redeemable capital securities, less nonqualifying intangible assets, net of
85