BB&T 2010 Annual Report Download - page 150
Download and view the complete annual report
Please find page 150 of the 2010 BB&T annual report below. You can navigate through the pages in the report by either clicking on the pages listed below, or by using the keyword search tool below to find specific information within the annual report.-
 1
1 -
2
-
3
-
4
-
5
-
6
-
7
-
8
-
9
-
10
-
11
-
12
-
13
-
14
-
15
-
16
-
17
-
18
-
19
-
20
-
21
-
22
-
23
-
24
-
25
-
26
-
27
-
28
-
29
-
30
-
31
-
32
-
33
-
34
-
35
-
36
-
37
-
38
-
39
-
40
-
41
-
42
-
43
-
44
-
45
-
46
-
47
-
48
-
49
-
50
-
51
-
52
-
53
-
54
-
55
-
56
-
57
-
58
-
59
-
60
-
61
-
62
-
63
-
64
-
65
-
66
-
67
-
68
-
69
-
70
-
71
-
72
-
73
-
74
-
75
-
76
-
77
-
78
-
79
-
80
-
81
-
82
-
83
-
84
-
85
-
86
-
87
-
88
-
89
-
90
-
91
-
92
-
93
-
94
-
95
-
96
-
97
-
98
-
99
-
100
-
101
-
102
-
103
-
104
-
105
-
106
-
107
-
108
-
109
-
110
-
111
-
112
-
113
-
114
-
115
-
116
-
117
-
118
-
119
-
120
-
121
-
122
-
123
-
124
-
125
-
126
-
127
-
128
-
129
-
130
-
131
-
132
-
133
-
134
-
135
-
136
-
137
-
138
-
139
-
 140
140 -
 141
141 -
 142
142 -
 143
143 -
 144
144 -
 145
145 -
 146
146 -
 147
147 -
 148
148 -
 149
149 -
 150
150 -
 151
151 -
 152
152 -
 153
153 -
 154
154 -
 155
155 -
 156
156 -
 157
157 -
 158
158 -
 159
159 -
 160
160 -
161
-
162
-
163
-
164
-
165
-
166
-
167
-
168
-
169
-
170
-
171
-
172
-
173
-
174
-
175
-
176
-
177
-
178
-
179
-
180
-
181
 |
 |

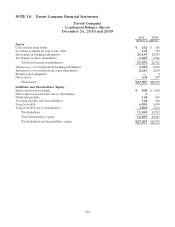
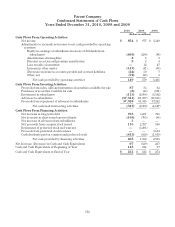
NOTE 18. Parent Company Financial Statements
Parent Company
Condensed Balance Sheets
December 31, 2010 and 2009
2010 2009
(Dollars in millions)
Assets
Cash and due from banks $ 212 $ 145
Securities available for sale at fair value 104 170
Investment in banking subsidiaries 20,187 19,575
Investment in other subsidiaries 1,485 1,736
Total investments in subsidiaries 21,672 21,311
Advances to / receivables from banking subsidiaries 3,065 2,817
Advances to / receivables from other subsidiaries 2,213 2,259
Premises and equipment —4
Other assets 331 267
Total assets $27,597 $26,973
Liabilities and Shareholders’ Equity
Short-term borrowed funds $ 806 $ 1,004
Short-term borrowed funds due to subsidiaries 3—
Dividends payable 104 103
Accounts payable and other liabilities 124 142
Long-term debt 6,254 5,899
Long-term debt due to subsidiaries 3,808 3,584
Total liabilities 11,099 10,732
Total shareholders’ equity 16,498 16,241
Total liabilities and shareholders’ equity $27,597 $26,973
150