BB&T 2010 Annual Report Download - page 18
Download and view the complete annual report
Please find page 18 of the 2010 BB&T annual report below. You can navigate through the pages in the report by either clicking on the pages listed below, or by using the keyword search tool below to find specific information within the annual report.-
 1
1 -
2
-
3
-
4
-
5
-
6
-
7
-
 8
8 -
 9
9 -
 10
10 -
 11
11 -
 12
12 -
 13
13 -
 14
14 -
 15
15 -
 16
16 -
 17
17 -
 18
18 -
 19
19 -
 20
20 -
 21
21 -
 22
22 -
 23
23 -
 24
24 -
 25
25 -
 26
26 -
 27
27 -
 28
28 -
29
-
30
-
31
-
32
-
33
-
34
-
35
-
36
-
37
-
38
-
39
-
40
-
41
-
42
-
43
-
44
-
45
-
46
-
47
-
48
-
49
-
50
-
51
-
52
-
53
-
54
-
55
-
56
-
57
-
58
-
59
-
60
-
61
-
62
-
63
-
64
-
65
-
66
-
67
-
68
-
69
-
70
-
71
-
72
-
73
-
74
-
75
-
76
-
77
-
78
-
79
-
80
-
81
-
82
-
83
-
84
-
85
-
86
-
87
-
88
-
89
-
90
-
91
-
92
-
93
-
94
-
95
-
96
-
97
-
98
-
99
-
100
-
101
-
102
-
103
-
104
-
105
-
106
-
107
-
108
-
109
-
110
-
111
-
112
-
113
-
114
-
115
-
116
-
117
-
118
-
119
-
120
-
121
-
122
-
123
-
124
-
125
-
126
-
127
-
128
-
129
-
130
-
131
-
132
-
133
-
134
-
135
-
136
-
137
-
138
-
139
-
140
-
141
-
142
-
143
-
144
-
145
-
146
-
147
-
148
-
149
-
150
-
151
-
152
-
153
-
154
-
155
-
156
-
157
-
158
-
159
-
160
-
161
-
162
-
163
-
164
-
165
-
166
-
167
-
168
-
169
-
170
-
171
-
172
-
173
-
174
-
175
-
176
-
177
-
178
-
179
-
180
-
181
 |
 |
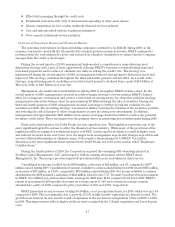
Credit costs remained high during 2010. BB&T recorded a $2.6 billion provision for credit losses in 2010
compared to a $2.8 billion provision for credit losses recorded during 2009. Net charge-offs for 2010 totaled $2.5
billion compared to $1.8 billion for 2009. Net charge-offs for 2010 included $605 million related to the
nonperforming assets disposition strategy. In addition, foreclosed property expenses were $747 million in 2010
compared to $356 million in 2009. However, nonperforming assets, excluding covered assets, declined 9.6% over
the last three quarters of 2010 due to the successful execution of BB&T’s nonperforming asset disposition
strategy.
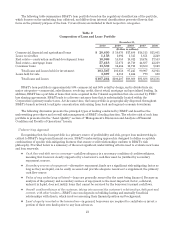
BB&T’s total assets at December 31, 2010 were $157.1 billion, a decrease of $8.7 billion, or 5.2%, compared to
December 31, 2009. Total loans and leases at December 31, 2010 were $107.3 billion, an increase of $1.1 billion, or
1.0%, compared to the balance at year-end 2009. Securities available for sale decreased $10.1 billion compared to
December 31, 2009, primarily due to the deleveraging strategy executed during the second quarter of 2010.
Total client deposits at December 31, 2010 were $100.0 billion, a decrease of $6.7 billion, or 6.3%, from
December 31, 2009. Total deposits, which include wholesale deposit sources, totaled $107.2 billion at December 31,
2010, a decrease of $7.8 billion, or 6.7%, compared to December 31, 2009. The decrease in client deposits was a
result of a decrease of $11.0 billion, or 34.0%, in certificates of deposit as more expensive deposits were not
renewed. BB&T has seen an improvement in the deposit mix with noninterest-bearing accounts representing
19.2% of total deposits at December 31, 2010, compared with 16.5% at December 31, 2009.
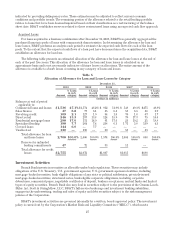
Total shareholders’ equity increased 1.6% compared to December 31, 2009. BB&T’s common equity increased
primarily as a result of retained earnings. The Tier 1 common ratio was 9.1% at December 31, 2010. In addition,
the Tier 1 risk-based capital and total risk-based capital ratios were 11.8% and 15.5% at December 31, 2010,
respectively. BB&T’s risk-based and tangible capital ratios remain well above regulatory standards for well-
capitalized banks. As of December 31, 2010, measures of tangible capital were not required by the regulators and,
therefore, were considered non-GAAP measures. Please refer to the section titled “Capital” herein for a
discussion of how BB&T calculates and uses these measures in the evaluation of the Company.
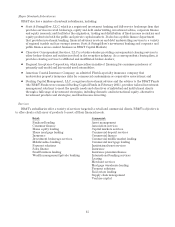
Competition
The financial services industry is highly competitive and dramatic change continues to occur in all aspects of
the Company’s business. The ability of nonbank financial entities to provide services previously reserved for
commercial banks has intensified competition. BB&T’s subsidiaries compete actively with national, regional and
local financial services providers, including banks, thrifts, securities dealers, mortgage bankers, finance
companies and insurance companies. Competition among providers of financial products and services continues to
increase, with consumers having the opportunity to select from a growing variety of traditional and
nontraditional alternatives. The industry continues to consolidate, which affects competition by eliminating some
regional and local institutions, while strengthening the franchises of acquirers. In addition, many financial
services entities are experiencing significant challenges as a result of the economic crisis, resulting in bank and
thrift failures and significant intervention from the U.S. Government. For additional information concerning
markets, BB&T’s competitive position and business strategies, and recent government interventions see “Market
Area”, “General Business Development” and “Regulatory Considerations” below.
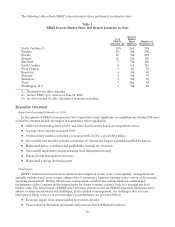
Market Area
BB&T’s primary market area for its banking operations consists of North and South Carolina, Virginia,
Maryland, Georgia, eastern Tennessee, West Virginia, Kentucky, Florida, Alabama and Washington, D.C. In
addition, BB&T has a smaller banking presence in Texas and Indiana. The Texas market represents a new
market for BB&T to expand its banking operations with entry occurring in connection with the Colonial
acquisition. The markets that BB&T operates have a diverse employment base and primarily consists of
manufacturing, general services, agricultural, wholesale/retail trade, technology, government and financial
services. BB&T believes its current market area will support growth in assets and deposits in the future.
Management strongly believes that BB&T’s community bank approach to providing client service is a
competitive advantage that strengthens the Corporation’s ability to effectively provide financial products and
services to businesses and individuals in its markets.
18