BB&T 2010 Annual Report Download - page 46
Download and view the complete annual report
Please find page 46 of the 2010 BB&T annual report below. You can navigate through the pages in the report by either clicking on the pages listed below, or by using the keyword search tool below to find specific information within the annual report.-
 1
1 -
2
-
3
-
4
-
5
-
6
-
7
-
8
-
9
-
10
-
11
-
12
-
13
-
14
-
15
-
16
-
17
-
18
-
19
-
20
-
21
-
22
-
23
-
24
-
25
-
26
-
27
-
28
-
29
-
30
-
31
-
32
-
33
-
34
-
35
-
 36
36 -
 37
37 -
 38
38 -
 39
39 -
 40
40 -
 41
41 -
 42
42 -
 43
43 -
 44
44 -
 45
45 -
 46
46 -
 47
47 -
 48
48 -
 49
49 -
 50
50 -
 51
51 -
 52
52 -
 53
53 -
 54
54 -
 55
55 -
 56
56 -
57
-
58
-
59
-
60
-
61
-
62
-
63
-
64
-
65
-
66
-
67
-
68
-
69
-
70
-
71
-
72
-
73
-
74
-
75
-
76
-
77
-
78
-
79
-
80
-
81
-
82
-
83
-
84
-
85
-
86
-
87
-
88
-
89
-
90
-
91
-
92
-
93
-
94
-
95
-
96
-
97
-
98
-
99
-
100
-
101
-
102
-
103
-
104
-
105
-
106
-
107
-
108
-
109
-
110
-
111
-
112
-
113
-
114
-
115
-
116
-
117
-
118
-
119
-
120
-
121
-
122
-
123
-
124
-
125
-
126
-
127
-
128
-
129
-
130
-
131
-
132
-
133
-
134
-
135
-
136
-
137
-
138
-
139
-
140
-
141
-
142
-
143
-
144
-
145
-
146
-
147
-
148
-
149
-
150
-
151
-
152
-
153
-
154
-
155
-
156
-
157
-
158
-
159
-
160
-
161
-
162
-
163
-
164
-
165
-
166
-
167
-
168
-
169
-
170
-
171
-
172
-
173
-
174
-
175
-
176
-
177
-
178
-
179
-
180
-
181
 |
 |

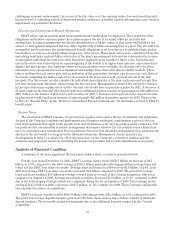
Short-term borrowings include Federal funds purchased, securities sold under repurchase agreements,
master notes, short-term bank notes, treasury tax and loan deposit notes payable and other short-term
borrowings. Average short-term borrowings totaled $9.0 billion for the year ended December 31, 2010, a decrease
of $3.5 billion, or 27.8%, from 2009. BB&T also has used long-term debt for a significant portion of its funding
needs. Long-term debt includes Federal Home Loan Bank (“FHLB”) advances, other secured borrowings by
Branch Bank, capital securities issued by unconsolidated trusts and senior and subordinated debt issued by the
Corporation and Branch Bank. Average long-term debt totaled $21.7 billion for the year ended December 31,
2010, an increase of $2.6 billion, or 13.5%, compared to 2009.
The compound annual rate of growth in average total assets for the five-year period ended December 31,
2010, was 8.8%. Over the same five-year period, average loans and leases increased at a compound annual rate of
7.9%, average securities increased at a compound annual rate of 7.1%, and average deposits grew at a compound
annual rate of 8.7%. These balance sheet growth rates include the effect of acquisitions, as well as internal
growth.
For more detailed discussions concerning the causes of these fluctuations, please refer to the sections that
follow.
Securities Available for Sale
The securities portfolio provides earnings and liquidity, and is managed as part of the overall asset and
liability management process to optimize net interest income and reduce exposure to interest rate risk.
Management has historically emphasized investments with duration of five years or less to provide flexibility in
managing the balance sheet in changing interest rate environments. Management believes that having the vast
majority of its investment securities in the available-for-sale portfolio allows flexibility in the management of the
overall investment portfolio, consistent with the objectives of optimizing profitability, mitigating interest rate
risk, supporting capital and providing liquidity.
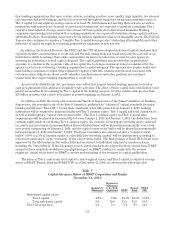
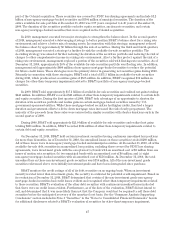
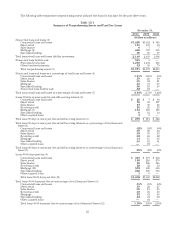
The following table provides information regarding the composition of BB&T’s available-for-sale securities
portfolio for the years presented:
Table 8
Composition of Securities Portfolio
December 31,
2010 2009 2008
(Dollars in millions)
Securities available for sale:
U.S. government-sponsored entities (GSE) $ 103 $ 2,035 $ 1,333
Mortgage-backed securities issued by GSE 18,344 26,670 27,430
States and political subdivisions 1,909 2,107 2,077
Non-agency mortgage-backed securities 515 1,022 1,098
Equity and other securities 759 218 426
Covered securities 1,539 1,201 —
Total securities available for sale $23,169 $33,253 $32,364
Total securities available for sale decreased 30.3% from year-end 2009 to year-end 2010, to $23.2 billion at
December 31, 2010. The decline during 2010 primarily reflects the deleveraging strategy executed during the
second quarter of 2010 as discussed below. Total securities available for sale increased $889 million in 2009
compared to 2008. The increase primarily reflects the additional securities acquired in the Colonial acquisition.
Mortgage-backed securities issued by government-sponsored entities comprised 79.2% of the total
available-for-sale securities portfolio at year-end 2010. The duration of the mortgage-backed securities was 3.10
years at December 31, 2010 compared to 3.37 years at December 31, 2009. As of December 31, 2010, the
available-for-sale securities portfolio also includes $1.5 billion of securities that were acquired from the FDIC as
46