BB&T 2010 Annual Report Download - page 61
Download and view the complete annual report
Please find page 61 of the 2010 BB&T annual report below. You can navigate through the pages in the report by either clicking on the pages listed below, or by using the keyword search tool below to find specific information within the annual report.-
 1
1 -
2
-
3
-
4
-
5
-
6
-
7
-
8
-
9
-
10
-
11
-
12
-
13
-
14
-
15
-
16
-
17
-
18
-
19
-
20
-
21
-
22
-
23
-
24
-
25
-
26
-
27
-
28
-
29
-
30
-
31
-
32
-
33
-
34
-
35
-
36
-
37
-
38
-
39
-
40
-
41
-
42
-
43
-
44
-
45
-
46
-
47
-
48
-
49
-
50
-
 51
51 -
 52
52 -
 53
53 -
 54
54 -
 55
55 -
 56
56 -
 57
57 -
 58
58 -
 59
59 -
 60
60 -
 61
61 -
 62
62 -
 63
63 -
 64
64 -
 65
65 -
 66
66 -
 67
67 -
 68
68 -
 69
69 -
 70
70 -
 71
71 -
72
-
73
-
74
-
75
-
76
-
77
-
78
-
79
-
80
-
81
-
82
-
83
-
84
-
85
-
86
-
87
-
88
-
89
-
90
-
91
-
92
-
93
-
94
-
95
-
96
-
97
-
98
-
99
-
100
-
101
-
102
-
103
-
104
-
105
-
106
-
107
-
108
-
109
-
110
-
111
-
112
-
113
-
114
-
115
-
116
-
117
-
118
-
119
-
120
-
121
-
122
-
123
-
124
-
125
-
126
-
127
-
128
-
129
-
130
-
131
-
132
-
133
-
134
-
135
-
136
-
137
-
138
-
139
-
140
-
141
-
142
-
143
-
144
-
145
-
146
-
147
-
148
-
149
-
150
-
151
-
152
-
153
-
154
-
155
-
156
-
157
-
158
-
159
-
160
-
161
-
162
-
163
-
164
-
165
-
166
-
167
-
168
-
169
-
170
-
171
-
172
-
173
-
174
-
175
-
176
-
177
-
178
-
179
-
180
-
181
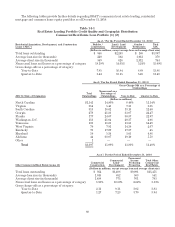
 |
 |

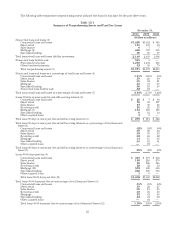
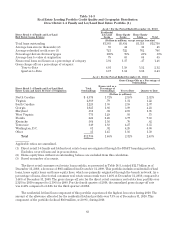
As of / For the Period Ended December 31, 2010
Gross Charge-Offs as a Percentage of
Outstandings
Other Commercial Real Estate Loans
by State of Origination (3) Total
Outstandings
Nonaccrual as a
Percentage of
Outstandings Year-to-Date Quarter-to-Date
(Dollars in millions)
North Carolina $ 3,520 2.55% 2.70% 1.89%
Virginia 1,866 1.04 1.16 1.18
Georgia 1,776 7.01 6.68 9.54
South Carolina 911 3.79 3.41 9.68
Florida 740 11.47 12.85 6.51
Washington, D.C. 660 3.01 3.71 4.39
Maryland 579 .54 .12 .45
Kentucky 453 1.01 1.44 .16
West Virginia 413 .76 1.15 .36
Tennessee 344 4.61 5.60 3.68
Alabama 90 5.77 4.09 4.01
Other 99 — 1.68 —
Total $11,451 3.53% 3.83% 3.94%
(1) Commercial real estate loans (“CRE”) are defined as loans to finance non-owner occupied real property
where the primary repayment source is the sale or rental/lease of the real property. Definition is based on
internal classification. Excludes covered loans and in process items.
(2) Includes net charge-offs and average balances related to loans transferred to held for sale while they were
held for investment. Loans transferred to held for sale are excluded from total loans outstanding. As of
December 31, 2010, there were $239 million ADC loans and $168 million other CRE loans held for sale. All of
the held for sale ADC and Other CRE loans are on nonaccrual status.
(3) C&I loans secured by real property are excluded.
The residential acquisition, development and construction (“ADC”) loan portfolio totaled $3.4 billion at
December 31, 2010, a decrease of $2.4 billion from December 31, 2009. This portfolio continues to represent the
largest concentration of credit quality issues. The decline in the portfolio reflects management’s efforts to work
through the problem credits in this portfolio. Management has established a target size of between $2 billion and
$3 billion for the ADC portfolio. As a percentage of loans held for investment, ADC nonaccruals were 15.09% at
year-end 2010, compared to 13.63% at year-end 2009. The allowance for loan and lease losses that is assigned to
the ADC portfolio was 13.8% as of December 31, 2010, compared to 14.1% as of year-end 2009. The gross
charge-off rate for the ADC portfolio was 13.86% for 2010 compared to 5.71% for 2009. For the fourth quarter of
2010, the annualized gross charge-off rate was 11.40% compared to 24.11% for the third quarter of 2010. The other
commercial real estate portfolio, which is largely office buildings, hotels, warehouses, apartments, rental houses,
and shopping centers, totaled $11.5 billion at December 31, 2010. The components of the portfolio that are
experiencing the most stress relate to land development and hotel properties. As a percentage of loans, other
commercial real estate nonaccruals were 3.53% at December 31, 2010, compared with 2.70% at December 31, 2009.
The gross charge-off rate for the other commercial real estate portfolio was 3.83% in 2010 compared to .76% for
2009. For the fourth quarter of 2010, the annualized gross charge-off rate was 3.94% compared to 8.11% for the
third quarter of 2010. The increased charge-off rates in the ADC and other commercial real estate portfolios
during 2010 include the impact of the additional charge-offs on loans transferred to loans held for sale as part of
the NPA disposition strategy. The vast majority of those losses were recorded in the third quarter of 2010.
61