BB&T 2010 Annual Report Download - page 92
Download and view the complete annual report
Please find page 92 of the 2010 BB&T annual report below. You can navigate through the pages in the report by either clicking on the pages listed below, or by using the keyword search tool below to find specific information within the annual report.-
 1
1 -
2
-
3
-
4
-
5
-
6
-
7
-
8
-
9
-
10
-
11
-
12
-
13
-
14
-
15
-
16
-
17
-
18
-
19
-
20
-
21
-
22
-
23
-
24
-
25
-
26
-
27
-
28
-
29
-
30
-
31
-
32
-
33
-
34
-
35
-
36
-
37
-
38
-
39
-
40
-
41
-
42
-
43
-
44
-
45
-
46
-
47
-
48
-
49
-
50
-
51
-
52
-
53
-
54
-
55
-
56
-
57
-
58
-
59
-
60
-
61
-
62
-
63
-
64
-
65
-
66
-
67
-
68
-
69
-
70
-
71
-
72
-
73
-
74
-
75
-
76
-
77
-
78
-
79
-
80
-
81
-
 82
82 -
 83
83 -
 84
84 -
 85
85 -
 86
86 -
 87
87 -
 88
88 -
 89
89 -
 90
90 -
 91
91 -
 92
92 -
 93
93 -
 94
94 -
 95
95 -
 96
96 -
 97
97 -
 98
98 -
 99
99 -
 100
100 -
 101
101 -
 102
102 -
103
-
104
-
105
-
106
-
107
-
108
-
109
-
110
-
111
-
112
-
113
-
114
-
115
-
116
-
117
-
118
-
119
-
120
-
121
-
122
-
123
-
124
-
125
-
126
-
127
-
128
-
129
-
130
-
131
-
132
-
133
-
134
-
135
-
136
-
137
-
138
-
139
-
140
-
141
-
142
-
143
-
144
-
145
-
146
-
147
-
148
-
149
-
150
-
151
-
152
-
153
-
154
-
155
-
156
-
157
-
158
-
159
-
160
-
161
-
162
-
163
-
164
-
165
-
166
-
167
-
168
-
169
-
170
-
171
-
172
-
173
-
174
-
175
-
176
-
177
-
178
-
179
-
180
-
181
 |
 |
Wealth Management Division. Additionally, Investment Services expanded their number of investment
counselors in 2010, contributing to strong revenue growth for their business, especially in the new markets
associated with the Colonial acquisition. Comparing 2009 to 2008, net income increased $74 million, or 86.0%,
based on an expansion of Corporate Banking initiatives, as well as strong performance from capital markets
activities and brokerage operations.
Net interest income for the Financial Services segment totaled $127 million in 2010, a decrease of $3 million,
or 2.3%, compared to 2009. Comparing 2009 to 2008, net interest income increased $52 million, or 66.7%. The
decrease in net interest income during 2010 was attributable to lower fixed-income revenue for Scott &
Stringfellow that was partially offset by strong organic loan growth in Corporate Banking. Corporate Banking
was also the strongest driver in the overall increase in net interest income for 2009.
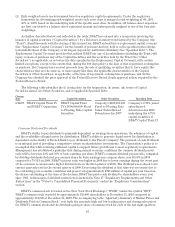
Noninterest income in the Financial Services segment in 2010 totaled $657 million, down $17 million, or 2.5%,
compared to $674 million earned during 2009. This decrease in 2010 is primarily attributed to the $27 million gain
realized in 2009 on the sale of BB&T’s payroll processing business. BB&T Capital Partners had strong revenue
growth in 2010 related to maturing investments in its private equity and mezzanine funds. Additionally, Sterling
Capital and the Wealth Management Division had strong noninterest income growth in 2010, with assets under
management growing as a result of improved market conditions and business initiatives. Noninterest income
increased by $45 million, or 7.2%, between 2008 and 2009. The revenue increase in 2009 was attributable to the
gain on the sale of BB&T’s payroll processing business and strong performances from the Wealth Management
Division and Capital Market’s Fixed Income sales and trading activities. Noninterest expenses of $533 million
incurred by Financial Services in 2010 declined $10 million compared to 2009, after declining $9 million in the
prior year.
Treasury
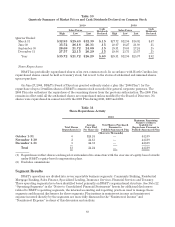
The Treasury segment is responsible for managing the liquidity position for the Corporation, investing excess
funds, and managing interest rate risk. Net income from the Treasury segment of $163 million for 2010 was down
$67 million, or 29.1%, from 2009. Net income in the Treasury segment is subject to fluctuations based on the
interest sensitivity of the Corporation’s balance sheet, the purchases and sales of securities, and the issuance and
retirement of funding vehicles. For 2009, net income of $230 million was down $177 million, or 43.5% from 2008.
Net interest income in the Treasury segment can vary due to changing needs of the Corporation, including
the size of the investment portfolio, the need for wholesale funding, and income received from derivatives used to
hedge the balance sheet. Net interest expense for the Treasury segment was $467 million in 2010 compared to net
interest expense of $59 million in 2009. Net interest expense for 2010 consisted of $156 million of net interest
income and $623 million of net interest expense from the FTP charge. For 2009, net interest income for the
Treasury segment consisted of $630 million of net interest income and $689 million of net interest expense from
the FTP charge.
During 2010, noninterest income earned by the Treasury segment totaled $643 million, an increase of 97.2%,
compared to $326 million earned during 2009. Noninterest income during 2010 included $578 million in gains on
the sale of securities, an increase of $339 million compared to $239 million of gains in 2009. These gains were
partially offset by other-than-temporary-impairment (“OTTI”) write downs of $31 million in 2010 and $7 million in
2009. For 2008, noninterest income within the Treasury segment totaled $265 million, and included net gains on
the sale of securities of $233 million and OTTI of $54 million.
The income tax benefit allocated to the Treasury segment during 2010 was $11 million compared to a
provision for income taxes of $28 million in 2009 and $157 million in 2008. The changes in the taxes allocated to the
Treasury segment are a combination of changes in the level of pre-tax income and tax-exempt income.
As of December 31, 2010, total identifiable assets in the Treasury segment were $27.8 billion, a decrease of
$8.8 billion, or 24.0%, from the prior year. This followed a decrease of $835 million, or 2.2%, in 2009 compared to
2008. The decrease in assets in 2010 reflects the implementation of a de-risking strategy whereby the portfolio
size was decreased through sales of securities and duration in the portfolio was reduced.
92