BB&T 2010 Annual Report Download - page 64
Download and view the complete annual report
Please find page 64 of the 2010 BB&T annual report below. You can navigate through the pages in the report by either clicking on the pages listed below, or by using the keyword search tool below to find specific information within the annual report.-
 1
1 -
2
-
3
-
4
-
5
-
6
-
7
-
8
-
9
-
10
-
11
-
12
-
13
-
14
-
15
-
16
-
17
-
18
-
19
-
20
-
21
-
22
-
23
-
24
-
25
-
26
-
27
-
28
-
29
-
30
-
31
-
32
-
33
-
34
-
35
-
36
-
37
-
38
-
39
-
40
-
41
-
42
-
43
-
44
-
45
-
46
-
47
-
48
-
49
-
50
-
51
-
52
-
53
-
 54
54 -
 55
55 -
 56
56 -
 57
57 -
 58
58 -
 59
59 -
 60
60 -
 61
61 -
 62
62 -
 63
63 -
 64
64 -
 65
65 -
 66
66 -
 67
67 -
 68
68 -
 69
69 -
 70
70 -
 71
71 -
 72
72 -
 73
73 -
 74
74 -
75
-
76
-
77
-
78
-
79
-
80
-
81
-
82
-
83
-
84
-
85
-
86
-
87
-
88
-
89
-
90
-
91
-
92
-
93
-
94
-
95
-
96
-
97
-
98
-
99
-
100
-
101
-
102
-
103
-
104
-
105
-
106
-
107
-
108
-
109
-
110
-
111
-
112
-
113
-
114
-
115
-
116
-
117
-
118
-
119
-
120
-
121
-
122
-
123
-
124
-
125
-
126
-
127
-
128
-
129
-
130
-
131
-
132
-
133
-
134
-
135
-
136
-
137
-
138
-
139
-
140
-
141
-
142
-
143
-
144
-
145
-
146
-
147
-
148
-
149
-
150
-
151
-
152
-
153
-
154
-
155
-
156
-
157
-
158
-
159
-
160
-
161
-
162
-
163
-
164
-
165
-
166
-
167
-
168
-
169
-
170
-
171
-
172
-
173
-
174
-
175
-
176
-
177
-
178
-
179
-
180
-
181
 |
 |

Deposits and Other Borrowings
Client deposits generated through the BB&T banking network are the largest source of funds used to
support asset growth. Total deposits at December 31, 2010, were $107.2 billion, a decrease of $7.8 billion, or 6.7%,
compared to year-end 2009. The decrease in deposits during 2010 was driven by an $11.0 billion, or 34.0%,
decrease in client certificates of deposit. Other client deposits, which include money market deposit accounts,
savings accounts, individual retirement accounts and other time deposits increased by $1.9 billion, or 3.7%,
compared to year-end 2009 and noninterest-bearing deposits increased by $1.7 billion, or 8.9%, from the prior
year. The overall decrease is primarily due to redemptions of wholesale deposits and higher rate certificates of
deposit in connection with BB&T’s balance sheet deleveraging, as well as the sale of approximately $850 million of
Nevada deposits acquired in the Colonial acquisition. For the year ended December 31, 2010, total deposits
averaged $106.8 billion, an increase of $4.4 billion, or 4.3%, compared to 2009. The increase in average deposits
was primarily the result of a $6.1 billion, or 13.6%, increase in average other client deposits, and a $3.4 billion, or
20.5%, increase in average noninterest-bearing deposits. These increases were partially offset by a decrease in
other interest-bearing deposits of $4.1 billion compared to the prior year. The increase in average deposits
included the impact of Colonial, which was acquired in August 2009.
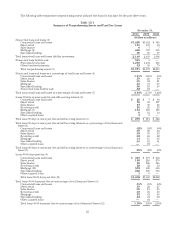
The following table presents BB&T’s average deposits for the years ended December 31, 2010 and 2009,
segregated by major category:
Table 15
Composition of Average Deposits
Years Ended December 31,
2010 2009
Balance %of
total Balance %of
total
(Dollars in millions)
Noninterest-bearing deposits $ 19,742 18.5% $ 16,387 16.0%
Interest checking 3,703 3.5 2,831 2.8
Other client deposits 51,239 47.9 45,107 44.1
Client certificates of deposit 26,872 25.2 28,702 28.0
Total client deposits 101,556 95.1 93,027 90.9
Other interest-bearing deposits 5,217 4.9 9,354 9.1
Total average deposits $106,773 100.0% $102,381 100.0%
The overall mix of deposits continued to improve in 2010. Average client deposits grew 9.2% due to strong
growth in noninterest-bearing and other client deposits, which was aided by the Colonial acquisition, while
reliance on other interest-bearing deposits declined. BB&T has been successful in attracting new business and
individual accounts by emphasizing the strength of BB&T’s franchise.
The average rate paid on interest-bearing deposits dropped to 1.05% during 2010, from 1.48% in 2009. The
average cost for interest-bearing deposits declined during 2010 as management was able to reduce its reliance on
relatively higher rate CDs. The average rates paid on the various categories of interest-bearing deposits also
decreased as follows: CDs decreased to 1.97% in the current year from 2.60% in 2009; other client deposits
decreased to .64% in the current year from .88% in 2009; interest checking decreased to .30% in 2010 from .39% in
2009; and other interest-bearing deposits decreased to .92% in 2010 from 1.23% in 2009.
BB&T also uses various types of short-term borrowings in meeting funding needs. While client deposits
remain the primary source for funding loan originations, management uses short-term borrowings as a
supplementary funding source for loan growth and other balance sheet management purposes. Short-term
borrowings were 5.7% of total funding on average in 2010 as compared to 8.0% in 2009. See Note 9 “Federal
Funds Purchased, Securities Sold Under Agreements to Repurchase and Short-Term Borrowed Funds” in the
“Notes to Consolidated Financial Statements” herein for further disclosure. The types of short-term borrowings
used by the Corporation include Federal funds purchased, which was .4% of total short-term borrowings, and
64