BB&T 2010 Annual Report Download - page 115
Download and view the complete annual report
Please find page 115 of the 2010 BB&T annual report below. You can navigate through the pages in the report by either clicking on the pages listed below, or by using the keyword search tool below to find specific information within the annual report.-
 1
1 -
2
-
3
-
4
-
5
-
6
-
7
-
8
-
9
-
10
-
11
-
12
-
13
-
14
-
15
-
16
-
17
-
18
-
19
-
20
-
21
-
22
-
23
-
24
-
25
-
26
-
27
-
28
-
29
-
30
-
31
-
32
-
33
-
34
-
35
-
36
-
37
-
38
-
39
-
40
-
41
-
42
-
43
-
44
-
45
-
46
-
47
-
48
-
49
-
50
-
51
-
52
-
53
-
54
-
55
-
56
-
57
-
58
-
59
-
60
-
61
-
62
-
63
-
64
-
65
-
66
-
67
-
68
-
69
-
70
-
71
-
72
-
73
-
74
-
75
-
76
-
77
-
78
-
79
-
80
-
81
-
82
-
83
-
84
-
85
-
86
-
87
-
88
-
89
-
90
-
91
-
92
-
93
-
94
-
95
-
96
-
97
-
98
-
99
-
100
-
101
-
102
-
103
-
104
-
 105
105 -
 106
106 -
 107
107 -
 108
108 -
 109
109 -
 110
110 -
 111
111 -
 112
112 -
 113
113 -
 114
114 -
 115
115 -
 116
116 -
 117
117 -
 118
118 -
 119
119 -
 120
120 -
 121
121 -
 122
122 -
 123
123 -
 124
124 -
 125
125 -
126
-
127
-
128
-
129
-
130
-
131
-
132
-
133
-
134
-
135
-
136
-
137
-
138
-
139
-
140
-
141
-
142
-
143
-
144
-
145
-
146
-
147
-
148
-
149
-
150
-
151
-
152
-
153
-
154
-
155
-
156
-
157
-
158
-
159
-
160
-
161
-
162
-
163
-
164
-
165
-
166
-
167
-
168
-
169
-
170
-
171
-
172
-
173
-
174
-
175
-
176
-
177
-
178
-
179
-
180
-
181
 |
 |

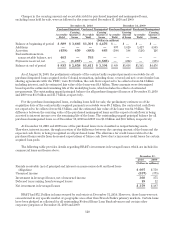
As of December 31, 2010, the fair value of covered securities included $1.2 billion of non-agency mortgage-
backed securities and $304 million of municipal securities. As of December 31, 2009, the fair value of covered
securities included $896 million of non-agency mortgage-backed securities and $305 million of municipal
securities. All covered securities were acquired from Colonial and are covered by one of the FDIC loss sharing
agreements. BB&T is restricted from selling these securities without prior approval from the FDIC.
At December 31, 2010 and 2009, securities with carrying values of approximately $19.3 billion and $22.6
billion, respectively, were pledged to secure municipal deposits, securities sold under agreements to repurchase,
other borrowings, and for other purposes as required or permitted by law.
BB&T had certain investments in marketable debt securities and mortgage-backed securities issued by
Fannie Mae and Freddie Mac that exceeded ten percent of shareholders’ equity at December 31, 2010. The
Fannie Mae investments had total amortized cost and fair values of $9.4 billion and $9.3 billion, respectively, at
December 31, 2010, while Freddie Mac investments had total amortized cost and fair values of $7.7 billion and $7.5
billion, respectively.
At December 31, 2010 and 2009, non-agency mortgage-backed securities primarily consisted of residential
mortgage-backed securities.
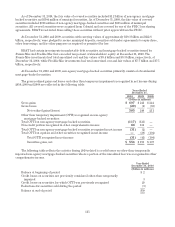
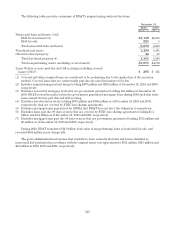
The gross realized gains and losses and other than temporary impairments recognized in net income during
2010, 2009 and 2008 are reflected in the following table:
Years-Ended
December 31,
2010 2009 2008
(Dollars in millions)
Gross gains $ 607 $ 241 $ 244
Gross losses (22) (1) (33)
Net realized gains/(losses) 585 240 211
Other than temporary impairment (OTTI) recognized on non-agency
mortgage-backed securities:
Total OTTI on non-agency mortgage-backed securities (117) (133) —
Non-credit portion recognized in other comprehensive income 86 131 —
Total OTTI on non-agency mortgage-backed securities recognized in net income (31) (2) —
Total OTTI on equities and other securities recognized in net income —(39) (104)
Total OTTI recognized in net income (31) (41) (104)
Securities gains, net $ 554 $ 199 $ 107
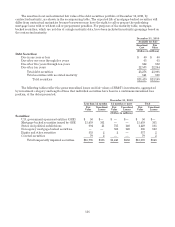
The following table reflects the activity during 2010 related to credit losses on other-than-temporarily
impaired non-agency mortgage-backed securities where a portion of the unrealized loss was recognized in other
comprehensive income.
Year-Ended
December 31, 2010
(Dollars in millions)
Balance at beginning of period $ 2
Credit losses on securities not previously considered other-than-temporarily
impaired 3
Credit losses on securities for which OTTI was previously recognized 28
Reductions for securities sold during the period (3)
Balance at end of period $30
115