BB&T 2010 Annual Report Download - page 151
Download and view the complete annual report
Please find page 151 of the 2010 BB&T annual report below. You can navigate through the pages in the report by either clicking on the pages listed below, or by using the keyword search tool below to find specific information within the annual report.-
 1
1 -
2
-
3
-
4
-
5
-
6
-
7
-
8
-
9
-
10
-
11
-
12
-
13
-
14
-
15
-
16
-
17
-
18
-
19
-
20
-
21
-
22
-
23
-
24
-
25
-
26
-
27
-
28
-
29
-
30
-
31
-
32
-
33
-
34
-
35
-
36
-
37
-
38
-
39
-
40
-
41
-
42
-
43
-
44
-
45
-
46
-
47
-
48
-
49
-
50
-
51
-
52
-
53
-
54
-
55
-
56
-
57
-
58
-
59
-
60
-
61
-
62
-
63
-
64
-
65
-
66
-
67
-
68
-
69
-
70
-
71
-
72
-
73
-
74
-
75
-
76
-
77
-
78
-
79
-
80
-
81
-
82
-
83
-
84
-
85
-
86
-
87
-
88
-
89
-
90
-
91
-
92
-
93
-
94
-
95
-
96
-
97
-
98
-
99
-
100
-
101
-
102
-
103
-
104
-
105
-
106
-
107
-
108
-
109
-
110
-
111
-
112
-
113
-
114
-
115
-
116
-
117
-
118
-
119
-
120
-
121
-
122
-
123
-
124
-
125
-
126
-
127
-
128
-
129
-
130
-
131
-
132
-
133
-
134
-
135
-
136
-
137
-
138
-
139
-
140
-
 141
141 -
 142
142 -
 143
143 -
 144
144 -
 145
145 -
 146
146 -
 147
147 -
 148
148 -
 149
149 -
 150
150 -
 151
151 -
 152
152 -
 153
153 -
 154
154 -
 155
155 -
 156
156 -
 157
157 -
 158
158 -
 159
159 -
 160
160 -
 161
161 -
162
-
163
-
164
-
165
-
166
-
167
-
168
-
169
-
170
-
171
-
172
-
173
-
174
-
175
-
176
-
177
-
178
-
179
-
180
-
181
 |
 |

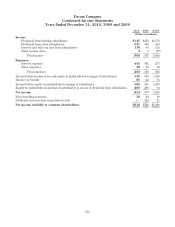
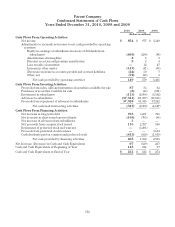
Parent Company
Condensed Income Statements
Years Ended December 31, 2010, 2009 and 2008
2010 2009 2008
(Dollars in millions)
Income
Dividends from banking subsidiaries $345 $459 $1,172
Dividends from other subsidiaries 321 306 404
Interest and other income from subsidiaries 138 89 155
Other income (loss) 43 (67)
Total income 808 857 1,664
Expenses
Interest expense 445 302 273
Other expenses 38 16 32
Total expenses 483 318 305
Income before income taxes and equity in undistributed earnings of subsidiaries 325 539 1,359
Income tax benefit 60 42 76
Income before equity in undistributed earnings of subsidiaries 385 581 1,435
Equity in undistributed earnings of subsidiaries in excess of dividends from subsidiaries 469 296 94
Net income 854 877 1,529
Noncontrolling interests 38 24 10
Dividends and accretion on preferred stock —124 21
Net income available to common shareholders $816 $729 $1,498
151