BB&T 2010 Annual Report Download - page 119
Download and view the complete annual report
Please find page 119 of the 2010 BB&T annual report below. You can navigate through the pages in the report by either clicking on the pages listed below, or by using the keyword search tool below to find specific information within the annual report.-
 1
1 -
2
-
3
-
4
-
5
-
6
-
7
-
8
-
9
-
10
-
11
-
12
-
13
-
14
-
15
-
16
-
17
-
18
-
19
-
20
-
21
-
22
-
23
-
24
-
25
-
26
-
27
-
28
-
29
-
30
-
31
-
32
-
33
-
34
-
35
-
36
-
37
-
38
-
39
-
40
-
41
-
42
-
43
-
44
-
45
-
46
-
47
-
48
-
49
-
50
-
51
-
52
-
53
-
54
-
55
-
56
-
57
-
58
-
59
-
60
-
61
-
62
-
63
-
64
-
65
-
66
-
67
-
68
-
69
-
70
-
71
-
72
-
73
-
74
-
75
-
76
-
77
-
78
-
79
-
80
-
81
-
82
-
83
-
84
-
85
-
86
-
87
-
88
-
89
-
90
-
91
-
92
-
93
-
94
-
95
-
96
-
97
-
98
-
99
-
100
-
101
-
102
-
103
-
104
-
105
-
106
-
107
-
108
-
 109
109 -
 110
110 -
 111
111 -
 112
112 -
 113
113 -
 114
114 -
 115
115 -
 116
116 -
 117
117 -
 118
118 -
 119
119 -
 120
120 -
 121
121 -
 122
122 -
 123
123 -
 124
124 -
 125
125 -
 126
126 -
 127
127 -
 128
128 -
 129
129 -
130
-
131
-
132
-
133
-
134
-
135
-
136
-
137
-
138
-
139
-
140
-
141
-
142
-
143
-
144
-
145
-
146
-
147
-
148
-
149
-
150
-
151
-
152
-
153
-
154
-
155
-
156
-
157
-
158
-
159
-
160
-
161
-
162
-
163
-
164
-
165
-
166
-
167
-
168
-
169
-
170
-
171
-
172
-
173
-
174
-
175
-
176
-
177
-
178
-
179
-
180
-
181
 |
 |

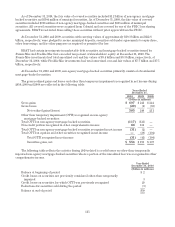
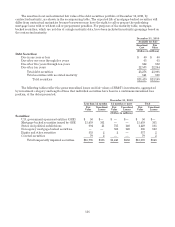
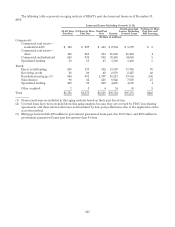
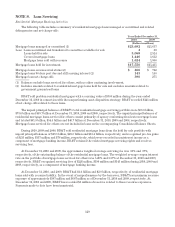
NOTE 4. Loans and Leases
The following table provides a breakdown of BB&T’s loan portfolio as of December 31, 2010 and 2009:
December 31,
2010 2009
(Dollars in millions)
Loans and leases, net of unearned income:
Commercial $ 48,886 $ 49,820
Sales finance 7,050 6,290
Revolving credit 2,127 2,016
Direct retail 13,749 14,283
Residential mortgage 17,550 15,435
Specialized lending 7,953 7,670
Other acquired 58 123
Total loans and leases held for investment (excluding covered loans) 97,373 95,637
Covered 6,194 8,019
Total loans and leases held for investment (1) 103,567 103,656
Loans held for sale 3,697 2,551
Total loans and leases $107,264 $106,207
(1) Unearned income and net deferred loan fees and costs totaled $570 million and $580 million at December 31,
2010 and 2009, respectively.
Covered loans represent loans acquired from the FDIC subject to one of the loss sharing agreements. Other
acquired loans represent consumer loans acquired from the FDIC that are not subject to one of the loss sharing
agreements.
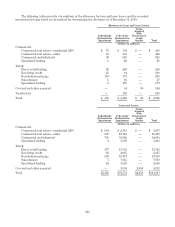
BB&T evaluated purchased loans for impairment. Purchased loans with evidence of credit deterioration since
origination and for which it is probable that all contractually required payments will not be collected are
considered impaired. The following table reflects the carrying value of all purchased impaired and nonimpaired
loans as of December 31, 2010 and 2009:
December 31, 2010 December 31, 2009
Purchased
Impaired
Loans
Purchased
Nonimpaired
Loans Total
Purchased
Impaired
Loans
Purchased
Nonimpaired
Loans Total
(Dollars in millions)
Residential mortgage loans $ 733 $ 713 $1,446 $ 826 $ 806 $1,632
Commercial real estate loans 2,031 1,982 4,013 2,732 2,574 5,306
Commercial loans 91 644 735 94 987 1,081
Total covered loans 2,855 3,339 6,194 3,652 4,367 8,019
Other acquired loans 3555814 109 123
Total 2,858 3,394 6,252 3,666 4,476 8,142
Allowance for loans losses (90) (54) (144) ———
Net $2,768 $3,340 $6,108 $3,666 $4,476 $8,142
119