BB&T 2010 Annual Report Download - page 156
Download and view the complete annual report
Please find page 156 of the 2010 BB&T annual report below. You can navigate through the pages in the report by either clicking on the pages listed below, or by using the keyword search tool below to find specific information within the annual report.-
 1
1 -
2
-
3
-
4
-
5
-
6
-
7
-
8
-
9
-
10
-
11
-
12
-
13
-
14
-
15
-
16
-
17
-
18
-
19
-
20
-
21
-
22
-
23
-
24
-
25
-
26
-
27
-
28
-
29
-
30
-
31
-
32
-
33
-
34
-
35
-
36
-
37
-
38
-
39
-
40
-
41
-
42
-
43
-
44
-
45
-
46
-
47
-
48
-
49
-
50
-
51
-
52
-
53
-
54
-
55
-
56
-
57
-
58
-
59
-
60
-
61
-
62
-
63
-
64
-
65
-
66
-
67
-
68
-
69
-
70
-
71
-
72
-
73
-
74
-
75
-
76
-
77
-
78
-
79
-
80
-
81
-
82
-
83
-
84
-
85
-
86
-
87
-
88
-
89
-
90
-
91
-
92
-
93
-
94
-
95
-
96
-
97
-
98
-
99
-
100
-
101
-
102
-
103
-
104
-
105
-
106
-
107
-
108
-
109
-
110
-
111
-
112
-
113
-
114
-
115
-
116
-
117
-
118
-
119
-
120
-
121
-
122
-
123
-
124
-
125
-
126
-
127
-
128
-
129
-
130
-
131
-
132
-
133
-
134
-
135
-
136
-
137
-
138
-
139
-
140
-
141
-
142
-
143
-
144
-
145
-
 146
146 -
 147
147 -
 148
148 -
 149
149 -
 150
150 -
 151
151 -
 152
152 -
 153
153 -
 154
154 -
 155
155 -
 156
156 -
 157
157 -
 158
158 -
 159
159 -
 160
160 -
 161
161 -
 162
162 -
 163
163 -
 164
164 -
 165
165 -
 166
166 -
167
-
168
-
169
-
170
-
171
-
172
-
173
-
174
-
175
-
176
-
177
-
178
-
179
-
180
-
181
 |
 |

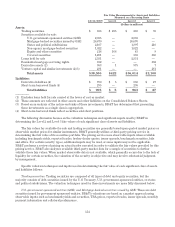
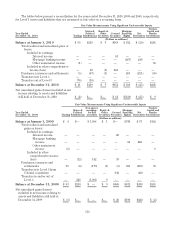
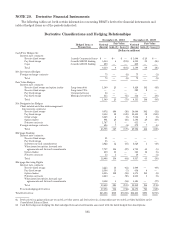
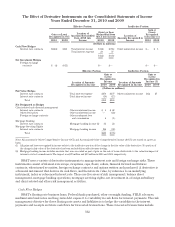
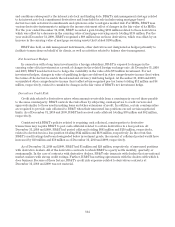
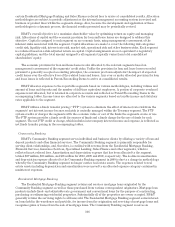
The tables below present a reconciliation for the years ended December 31, 2010, 2009 and 2008, respectively,
for Level 3 assets and liabilities that are measured at fair value on a recurring basis.
Fair Value Measurements Using Significant Unobservable Inputs
Year Ended
December 31, 2010 Trading
States &
Political
Subdivisions
Equity &
Other
Securities Covered
Securities
Mortgage
Servicing
Rights Net
Derivatives
Venture
Capital and
Similar
Investments
(Dollars in millions)
Balance at January 1, 2010 $ 93 $210 $ 9 $668 $ 832 $ (20) $281
Total realized and unrealized gains or
losses:
Included in earnings:
Interest income — — — 61 — — —
Mortgage banking income — — — — (267) 246 —
Other noninterest income (1) — — — — — 35
Included in other comprehensive
income (loss) — 12 (1) 225 — — —
Purchases, issuances and settlements (5) (87) (1) — 265 (251) (50)
Transfers into Level 3 — — — — — — —
Transfers out of Level 3 (76) (16) — — — — —
Balance at December 31, 2010 $ 11 $119 $ 7 $954 $ 830 $ (25) $266
Net unrealized gains (losses) included in net
income relating to assets and liabilities
still held at December 31, 2010 $ (2) $— $— $ 61 $(138) $ (25) $ 9
Fair Value Measurements Using Significant Unobservable Inputs
Year Ended
December 31, 2009 Trading
States &
Political
Subdivisions
Non-agency
mortgage-
backed
securities
Equity &
Other
Securities Covered
Securities
Mortgage
Servicing
Rights Net
Derivatives
Venture
Capital and
Similar
Investments
(Dollars in millions)
Balance at January 1, 2009 $ 4 $— $ 1,098 $ 1 $— $370 $ 37 $182
Total realized and unrealized
gains or losses:
Included in earnings:
Interest income — — — — 20 — — —
Mortgage banking
income — — — — — 64 222 —
Other noninterest
income (2) — — — — — — 6
Included in other
comprehensive income
(loss) — (12) 142 — 19 — — —
Purchases, issuances and
settlements 91 (6) (179) (1) (3) 398 (259) 93
Transfers into Level 3 from
Colonial acquisition — — — — 632 — (20) —
Transfers in and/or out of
Level 3 — 228 (1,061) 9 — — — —
Balance at December 31, 2009 $ 93 $210 $ — $ 9 $668 $832 $(20) $281
Net unrealized gains (losses)
included in net income relating to
assets and liabilities still held at
December 31, 2009 $ (3) $— $ — $— $ 20 $190 $(20) $ (2)
156