BB&T 2010 Annual Report Download - page 52
Download and view the complete annual report
Please find page 52 of the 2010 BB&T annual report below. You can navigate through the pages in the report by either clicking on the pages listed below, or by using the keyword search tool below to find specific information within the annual report.-
 1
1 -
2
-
3
-
4
-
5
-
6
-
7
-
8
-
9
-
10
-
11
-
12
-
13
-
14
-
15
-
16
-
17
-
18
-
19
-
20
-
21
-
22
-
23
-
24
-
25
-
26
-
27
-
28
-
29
-
30
-
31
-
32
-
33
-
34
-
35
-
36
-
37
-
38
-
39
-
40
-
41
-
 42
42 -
 43
43 -
 44
44 -
 45
45 -
 46
46 -
 47
47 -
 48
48 -
 49
49 -
 50
50 -
 51
51 -
 52
52 -
 53
53 -
 54
54 -
 55
55 -
 56
56 -
 57
57 -
 58
58 -
 59
59 -
 60
60 -
 61
61 -
 62
62 -
63
-
64
-
65
-
66
-
67
-
68
-
69
-
70
-
71
-
72
-
73
-
74
-
75
-
76
-
77
-
78
-
79
-
80
-
81
-
82
-
83
-
84
-
85
-
86
-
87
-
88
-
89
-
90
-
91
-
92
-
93
-
94
-
95
-
96
-
97
-
98
-
99
-
100
-
101
-
102
-
103
-
104
-
105
-
106
-
107
-
108
-
109
-
110
-
111
-
112
-
113
-
114
-
115
-
116
-
117
-
118
-
119
-
120
-
121
-
122
-
123
-
124
-
125
-
126
-
127
-
128
-
129
-
130
-
131
-
132
-
133
-
134
-
135
-
136
-
137
-
138
-
139
-
140
-
141
-
142
-
143
-
144
-
145
-
146
-
147
-
148
-
149
-
150
-
151
-
152
-
153
-
154
-
155
-
156
-
157
-
158
-
159
-
160
-
161
-
162
-
163
-
164
-
165
-
166
-
167
-
168
-
169
-
170
-
171
-
172
-
173
-
174
-
175
-
176
-
177
-
178
-
179
-
180
-
181
 |
 |

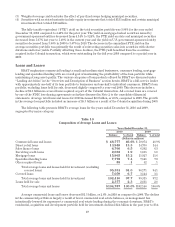
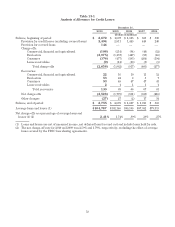
The following table summarizes asset quality information for the past five years.
Table 11
Asset Quality
December 31,
2010 2009 2008 2007 2006
(Dollars in millions)
Nonaccrual loans and leases $2,149 $2,658 $1,396 $ 496 $ 254
Foreclosed property 1,301 1,509 617 194 89
Nonaccrual loans held for sale 521 5— ——
Nonperforming assets (excluding covered assets) (1)(2)(3) $3,971 $4,172 $2,013 $ 690 $ 343
Loans 90 days or more past due and still accruing (excluding
covered loans) (4)(5)(6) $ 295 $ 311 $ 424 $ 222 $ 100
Loans 30-89 days past due (excluding covered loans) (4)(7)(8) $1,408 $1,663 $2,022 $1,348 $ 947
Asset Quality Ratios (including covered loans and
foreclosed property)
Loans 30-89 days past due and still accruing as a
percentage of total loans and leases 1.65% 1.93% 2.05% 1.47% 1.13%
Loans 90 days or more past due and still accruing as a
percentage of total loans and leases 1.34 1.60 .43 .24 .12
Nonperforming loans and leases as a percentage of total
loans and leases 2.49 2.51 1.42 .54 .30
Total nonperforming assets as a percentage of:
Total assets 2.73 2.61 1.32 .52 .28
Loans and leases plus foreclosed property 3.94 4.02 2.03 .75 .41
Net charge-offs as a percentage of average loans and leases 2.41 1.74 .89 .38 .27
Allowance for loan and lease losses as a percentage of loans
and leases held for investment 2.62 2.51 1.62 1.10 1.07
Ratio of allowance for loan and lease losses to:
Net charge-offs 1.07x 1.47x 1.85x 2.97x 4.12x
Nonperforming loans and leases 1.26 .98 1.13 2.03 3.50
Asset Quality Ratios (excluding covered loans and
foreclosed property) (9)
Loans 30-89 days past due and still accruing as a
percentage of total loans and leases 1.39% 1.69% 2.05% 1.47% 1.13%
Loans 90 days or more past due and still accruing as a
percentage of total loans and leases .29 .32 .43 .24 .12
Nonperforming loans and leases as a percentage of total
loans and leases 2.64 2.71 1.42 .54 .30
Total nonperforming assets as a percentage of:
Total assets 2.64 2.65 1.32 .52 .28
Loans and leases plus foreclosed property 3.88 4.18 2.03 .75 .41
Net charge-offs as a percentage of average loans and leases 2.59 1.79 .89 .38 .27
Allowance for loan and lease losses as a percentage of loans
and leases held for investment 2.63 2.72 1.62 1.10 1.07
Ratio of allowance for loans and losses to:
Net charge-offs 1.01x 1.47x 1.85x 2.97x 4.12x
Nonperforming loans and leases held for investment 1.19 .98 1.13 2.03 3.50
(1) Covered and other acquired loans are considered to be performing due to the application of the accretion
method. Covered loans that are contractually past due are noted in the footnotes below.
(2) Excludes nonaccrual mortgage loans that are government guaranteed totaling $55 million, $17 million, $6
million, and $6 million as of December 31, 2009, December 31, 2008, December 31, 2007 and December 31,
2006, respectively. BB&T revised its nonaccrual policy related to FHA/VA guaranteed loans during 2010.
The change in policy resulted in a decrease in nonaccrual mortgage loans and an increase in mortgage loans
90 days past due and still accruing of approximately $79 million.
52