BB&T 2010 Annual Report Download - page 122
Download and view the complete annual report
Please find page 122 of the 2010 BB&T annual report below. You can navigate through the pages in the report by either clicking on the pages listed below, or by using the keyword search tool below to find specific information within the annual report.-
 1
1 -
2
-
3
-
4
-
5
-
6
-
7
-
8
-
9
-
10
-
11
-
12
-
13
-
14
-
15
-
16
-
17
-
18
-
19
-
20
-
21
-
22
-
23
-
24
-
25
-
26
-
27
-
28
-
29
-
30
-
31
-
32
-
33
-
34
-
35
-
36
-
37
-
38
-
39
-
40
-
41
-
42
-
43
-
44
-
45
-
46
-
47
-
48
-
49
-
50
-
51
-
52
-
53
-
54
-
55
-
56
-
57
-
58
-
59
-
60
-
61
-
62
-
63
-
64
-
65
-
66
-
67
-
68
-
69
-
70
-
71
-
72
-
73
-
74
-
75
-
76
-
77
-
78
-
79
-
80
-
81
-
82
-
83
-
84
-
85
-
86
-
87
-
88
-
89
-
90
-
91
-
92
-
93
-
94
-
95
-
96
-
97
-
98
-
99
-
100
-
101
-
102
-
103
-
104
-
105
-
106
-
107
-
108
-
109
-
110
-
111
-
 112
112 -
 113
113 -
 114
114 -
 115
115 -
 116
116 -
 117
117 -
 118
118 -
 119
119 -
 120
120 -
 121
121 -
 122
122 -
 123
123 -
 124
124 -
 125
125 -
 126
126 -
 127
127 -
 128
128 -
 129
129 -
 130
130 -
 131
131 -
 132
132 -
133
-
134
-
135
-
136
-
137
-
138
-
139
-
140
-
141
-
142
-
143
-
144
-
145
-
146
-
147
-
148
-
149
-
150
-
151
-
152
-
153
-
154
-
155
-
156
-
157
-
158
-
159
-
160
-
161
-
162
-
163
-
164
-
165
-
166
-
167
-
168
-
169
-
170
-
171
-
172
-
173
-
174
-
175
-
176
-
177
-
178
-
179
-
180
-
181
 |
 |

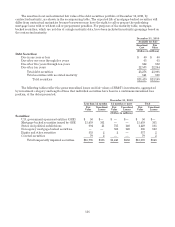
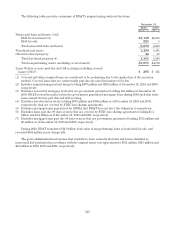
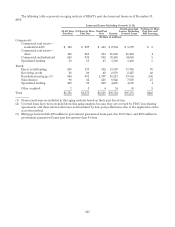
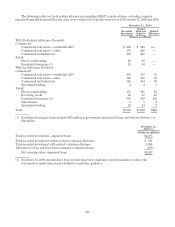
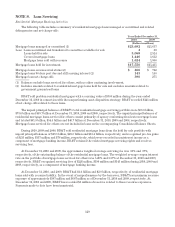
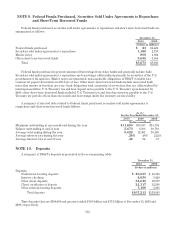
The following table provides a summary of loans that continue to accrue interest under the terms of the
restructuring (“performing restructurings”) and restructured loans that have been placed in nonaccrual status
(“nonperforming restructurings”):
December 31,
2010 2009
(Dollars in millions)
Performing restructurings: (1)(2)
Commercial loans and leases $ 657 $ 413
Sales finance loans 5—
Revolving credit loans 62 54
Direct retail loans 141 132
Residential mortgage loans (3) 585 471
Specialized lending loans 26 —
Total performing restructurings 1,476 1,070
Nonperforming restructurings (4)(5) 479 248
Total restructurings (6) $1,955 $1,318
(1) Prior period amounts were revised in 2010 to reflect the retrospective application of more definitive
regulatory guidance.
(2) Excludes restructured mortgage loans that are government guaranteed totaling $14 million included in loans
held for sale at December 31, 2010.
(3) Excludes restructured mortgage loans that are government guaranteed totaling $115 million at
December 31, 2010.
(4) Nonperforming restructurings are included in nonaccrual loan disclosures.
(5) Includes approximately $110 million of nonperforming restructurings included in loans held for sale at
December 31, 2010.
(6) All restructurings are considered impaired. The allowance for loan and lease losses attributable to these
restructured loans totaled $324 million and $164 million at December 31, 2010 and 2009, respectively.
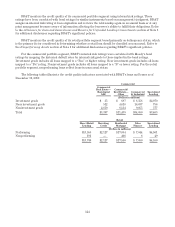
BB&T had commitments totaling $90 million and $18 million at December 31, 2010 and 2009, respectively, to
lend additional funds to clients with loans whose terms have been modified in restructurings.
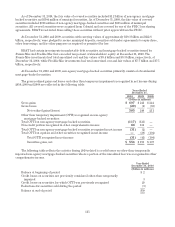
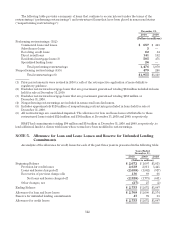
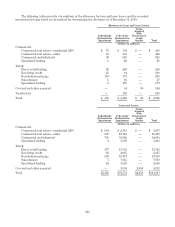
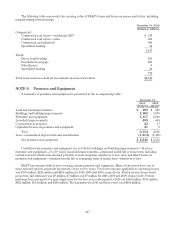
NOTE 5. Allowance for Loan and Lease Losses and Reserve for Unfunded Lending
Commitments
An analysis of the allowance for credit losses for each of the past three years is presented in the following table:
Years Ended
December 31,
2010 2009 2008
(Dollars in millions)
Beginning Balance $ 2,672 $ 1,607 $1,015
Provision for credit losses 2,638 2,811 1,445
Loans and leases charged-off (2,658) (1,862) (917)
Recoveries of previous charge-offs 130 89 66
Net loans and leases charged-off (2,528) (1,773) (851)
Other changes, net (27) 27 (2)
Ending Balance $ 2,755 $ 2,672 $1,607
Allowance for loan and lease losses $ 2,708 $ 2,600 $1,574
Reserve for unfunded lending commitments 47 72 33
Allowance for credit losses $ 2,755 $ 2,672 $1,607
122