BB&T 2010 Annual Report Download - page 169
Download and view the complete annual report
Please find page 169 of the 2010 BB&T annual report below. You can navigate through the pages in the report by either clicking on the pages listed below, or by using the keyword search tool below to find specific information within the annual report.-
 1
1 -
2
-
3
-
4
-
5
-
6
-
7
-
8
-
9
-
10
-
11
-
12
-
13
-
14
-
15
-
16
-
17
-
18
-
19
-
20
-
21
-
22
-
23
-
24
-
25
-
26
-
27
-
28
-
29
-
30
-
31
-
32
-
33
-
34
-
35
-
36
-
37
-
38
-
39
-
40
-
41
-
42
-
43
-
44
-
45
-
46
-
47
-
48
-
49
-
50
-
51
-
52
-
53
-
54
-
55
-
56
-
57
-
58
-
59
-
60
-
61
-
62
-
63
-
64
-
65
-
66
-
67
-
68
-
69
-
70
-
71
-
72
-
73
-
74
-
75
-
76
-
77
-
78
-
79
-
80
-
81
-
82
-
83
-
84
-
85
-
86
-
87
-
88
-
89
-
90
-
91
-
92
-
93
-
94
-
95
-
96
-
97
-
98
-
99
-
100
-
101
-
102
-
103
-
104
-
105
-
106
-
107
-
108
-
109
-
110
-
111
-
112
-
113
-
114
-
115
-
116
-
117
-
118
-
119
-
120
-
121
-
122
-
123
-
124
-
125
-
126
-
127
-
128
-
129
-
130
-
131
-
132
-
133
-
134
-
135
-
136
-
137
-
138
-
139
-
140
-
141
-
142
-
143
-
144
-
145
-
146
-
147
-
148
-
149
-
150
-
151
-
152
-
153
-
154
-
155
-
156
-
157
-
158
-
 159
159 -
 160
160 -
 161
161 -
 162
162 -
 163
163 -
 164
164 -
 165
165 -
 166
166 -
 167
167 -
 168
168 -
 169
169 -
 170
170 -
 171
171 -
 172
172 -
 173
173 -
 174
174 -
 175
175 -
 176
176 -
 177
177 -
 178
178 -
 179
179 -
180
-
181
 |
 |

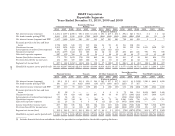
BB&T Corporation
Reportable Segments
Years Ended December 31, 2010, 2009 and 2008
Community Banking Residential Mortgage
Banking Sales Finance Specialized Lending Insurance Services
2010 2009 2008 2010 2009 2008 2010 2009 2008 2010 2009 2008 2010 2009 2008
(Dollars in millions)
Net interest income (expense) $ 1,834 $ 1,697 $ 2,098 $ 980 $ 1,065 $ 1,156 $ 391 $ 409 $ 401 $ 896 $ 825 $ 711 $ 3 $ 5 $ 12
Net funds transfer pricing (FTP) 2,003 1,931 1,136 (654) (722) (853) (244) (284) (281) (184) (220) (212) (2) (3) (5)
Net interest income (expense) and FTP 3,837 3,628 3,234 326 343 303 147 125 120 712 605 499 1 2 7
Economic provision for loan and lease
losses 1,792 1,874 840 570 333 134 34 90 40 155 332 301 — — —
Noninterest income 1,251 1,276 1,235 457 607 224 1 2 2 143 119 116 1,033 1,032 907
Intersegment net referral fees (expense) 408 461 254 (125) (146) (96) (13) (13) (13) — — — — — —
Noninterest expense 2,506 2,079 1,544 151 128 84 32 31 28 293 285 245 790 773 698
Allocated corporate expenses 827 699 700 11 11 10 9 12 11 42 40 37 59 51 42
Income (loss) before income taxes 371 713 1,639 (74) 332 203 60 (19) 30 365 67 32 185 210 174
Provision (benefit) for income taxes 134 265 587 (28) 126 73 23 (7) 11 139 24 12 73 82 67
Segment net income (loss) $ 237 $ 448 $ 1,052 $ (46) $ 206 $ 130 $ 37 $ (12) $ 19 $ 226 $ 43 $ 20 $ 112 $ 128 $ 107
Identifiable segment assets (period end) $60,414 $62,847 $64,842 $22,154 $19,040 $19,344 $6,814 $6,131 $6,117 $ 8,575 $ 8,162 $6,571 $ 1,215 $ 1,200 $ 1,253
Financial Services Treasury All Other Segments (1) Parent/Reconciling
Items Total BB&T Corporation
2010 2009 2008 2010 2009 2008 2010 2009 2008 2010 2009 2008 2010 2009 2008
(Dollars in millions)
Net interest income (expense) $ 21 $ 11 $ 44 $ 156 $ 630 $ 300 $ 183 $ 157 $ 107 $ 856 $ 45 $ (591)$ 5,320 $ 4,844 $ 4,238
Net funds transfer pricing (FTP) 106 119 34 (623) (689) (19) (177) (189) (167) (225) 57 367 — — —
Net interest income (expense) and FTP 127 130 78 (467) (59) 281 6 (32) (60) 631 102 (224) 5,320 4,844 4,238
Economic provision for loan and lease
losses 10 12 8 — — — 6 4 8 71 166 114 2,638 2,811 1,445
Noninterest income 657 674 629 643 326 265 49 38 30 (277) (140) (211) 3,957 3,934 3,197
Intersegment net referral fees (expense) 38 34 20 — — — — — — (308) (336) (165) — — —
Noninterest expense 533 543 552 20 5 (22) 65 71 24 1,280 1,016 758 5,670 4,931 3,911
Allocated corporate expenses 22 23 31 4 4 4 (1) (2) (1) (973) (838) (834) — — —
Income (loss) before income taxes 257 260 136 152 258 564 (15) (67) (61) (332) (718) (638) 969 1,036 2,079
Provision (benefit) for income taxes 98 100 50 (11) 28 157 (55) (68) (48) (258) (391) (359) 115 159 550
Segment net income (loss) $ 159 $ 160 $ 86 $ 163 $ 230 $ 407 $ 40 $ 1 $ (13) $ (74)$ (327)$ (279)$ 854 $ 877 $ 1,529
Identifiable segment assets (period end) $ 3,144 $ 3,077 $ 3,136 $27,807 $36,603 $37,438 $6,952 $5,306 $4,843 $20,006 $23,398 $8,471 $157,081 $165,764 $152,015
(1) Includes financial data from subsidiaries below the quantitative and qualitative thresholds requiring disclosure.
169