BB&T 2010 Annual Report Download - page 152
Download and view the complete annual report
Please find page 152 of the 2010 BB&T annual report below. You can navigate through the pages in the report by either clicking on the pages listed below, or by using the keyword search tool below to find specific information within the annual report.-
 1
1 -
2
-
3
-
4
-
5
-
6
-
7
-
8
-
9
-
10
-
11
-
12
-
13
-
14
-
15
-
16
-
17
-
18
-
19
-
20
-
21
-
22
-
23
-
24
-
25
-
26
-
27
-
28
-
29
-
30
-
31
-
32
-
33
-
34
-
35
-
36
-
37
-
38
-
39
-
40
-
41
-
42
-
43
-
44
-
45
-
46
-
47
-
48
-
49
-
50
-
51
-
52
-
53
-
54
-
55
-
56
-
57
-
58
-
59
-
60
-
61
-
62
-
63
-
64
-
65
-
66
-
67
-
68
-
69
-
70
-
71
-
72
-
73
-
74
-
75
-
76
-
77
-
78
-
79
-
80
-
81
-
82
-
83
-
84
-
85
-
86
-
87
-
88
-
89
-
90
-
91
-
92
-
93
-
94
-
95
-
96
-
97
-
98
-
99
-
100
-
101
-
102
-
103
-
104
-
105
-
106
-
107
-
108
-
109
-
110
-
111
-
112
-
113
-
114
-
115
-
116
-
117
-
118
-
119
-
120
-
121
-
122
-
123
-
124
-
125
-
126
-
127
-
128
-
129
-
130
-
131
-
132
-
133
-
134
-
135
-
136
-
137
-
138
-
139
-
140
-
141
-
 142
142 -
 143
143 -
 144
144 -
 145
145 -
 146
146 -
 147
147 -
 148
148 -
 149
149 -
 150
150 -
 151
151 -
 152
152 -
 153
153 -
 154
154 -
 155
155 -
 156
156 -
 157
157 -
 158
158 -
 159
159 -
 160
160 -
 161
161 -
 162
162 -
163
-
164
-
165
-
166
-
167
-
168
-
169
-
170
-
171
-
172
-
173
-
174
-
175
-
176
-
177
-
178
-
179
-
180
-
181
 |
 |

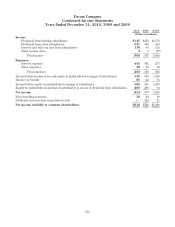
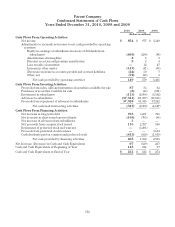
Parent Company
Condensed Statements of Cash Flows
Years Ended December 31, 2010, 2009 and 2008
2010 2009 2008
(Dollars in millions)
Cash Flows From Operating Activities:
Net income $ 854 $ 877 $ 1,529
Adjustments to reconcile net income to net cash provided by operating
activities:
Equity in earnings of subsidiaries in excess of dividends from
subsidiaries (469) (296) (94)
Amortization of intangibles 233
Discount accretion and premium amortization 524
Loss on sales of securities —12 47
Increase in other assets (147) (41) (38)
(Decrease) increase in accounts payable and accrued liabilities (24) 50 7
Other, net (72) (28) 3
Net cash provided by operating activities 149 579 1,461
Cash Flows From Investing Activities:
Proceeds from sales, calls and maturities of securities available for sale 87 33 62
Purchases of securities available for sale (8) (43) (161)
Investment in subsidiaries (113) (2,608) (3,102)
Advances to subsidiaries (37,341) (61,087) (38,168)
Proceeds from repayment of advances to subsidiaries 37,028 61,345 37,242
Net cash used in investing activities (347) (2,360) (4,127)
Cash Flows From Financing Activities:
Net increase in long-term debt 765 3,651 716
Net decrease in short-term borrowed funds (198) (705) (88)
Net increase in advances from subsidiaries 3——
Net proceeds from common stock issued 110 2,727 160
Retirement of preferred stock and warrant —(3,201) —
Proceeds from preferred stock issuance —— 3,134
Cash dividends paid on common and preferred stock (415) (820) (1,019)
Net cash provided by financing activities 265 1,652 2,903
Net Increase (Decrease) in Cash and Cash Equivalents 67 (129) 237
Cash and Cash Equivalents at Beginning of Year 145 274 37
Cash and Cash Equivalents at End of Year $ 212 $ 145 $ 274
152