BB&T 2010 Annual Report Download - page 136
Download and view the complete annual report
Please find page 136 of the 2010 BB&T annual report below. You can navigate through the pages in the report by either clicking on the pages listed below, or by using the keyword search tool below to find specific information within the annual report.-
 1
1 -
2
-
3
-
4
-
5
-
6
-
7
-
8
-
9
-
10
-
11
-
12
-
13
-
14
-
15
-
16
-
17
-
18
-
19
-
20
-
21
-
22
-
23
-
24
-
25
-
26
-
27
-
28
-
29
-
30
-
31
-
32
-
33
-
34
-
35
-
36
-
37
-
38
-
39
-
40
-
41
-
42
-
43
-
44
-
45
-
46
-
47
-
48
-
49
-
50
-
51
-
52
-
53
-
54
-
55
-
56
-
57
-
58
-
59
-
60
-
61
-
62
-
63
-
64
-
65
-
66
-
67
-
68
-
69
-
70
-
71
-
72
-
73
-
74
-
75
-
76
-
77
-
78
-
79
-
80
-
81
-
82
-
83
-
84
-
85
-
86
-
87
-
88
-
89
-
90
-
91
-
92
-
93
-
94
-
95
-
96
-
97
-
98
-
99
-
100
-
101
-
102
-
103
-
104
-
105
-
106
-
107
-
108
-
109
-
110
-
111
-
112
-
113
-
114
-
115
-
116
-
117
-
118
-
119
-
120
-
121
-
122
-
123
-
124
-
125
-
 126
126 -
 127
127 -
 128
128 -
 129
129 -
 130
130 -
 131
131 -
 132
132 -
 133
133 -
 134
134 -
 135
135 -
 136
136 -
 137
137 -
 138
138 -
 139
139 -
 140
140 -
 141
141 -
 142
142 -
 143
143 -
 144
144 -
 145
145 -
 146
146 -
147
-
148
-
149
-
150
-
151
-
152
-
153
-
154
-
155
-
156
-
157
-
158
-
159
-
160
-
161
-
162
-
163
-
164
-
165
-
166
-
167
-
168
-
169
-
170
-
171
-
172
-
173
-
174
-
175
-
176
-
177
-
178
-
179
-
180
-
181
 |
 |

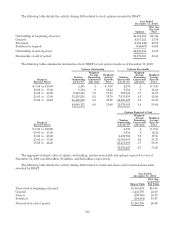
The following table details the activity during 2010 related to stock options awarded by BB&T:
Year Ended
December 31, 2010
Options
Wtd. Avg.
Exercise
Price
Outstanding at beginning of period 42,535,819 $35.40
Granted 4,657,121 27.74
Exercised (1,562,742) 22.99
Forfeited or expired (940,067) 34.00
Outstanding at end of period 44,690,131 35.06
Exercisable at end of period 32,670,568 36.84
The following tables summarize information about BB&T’s stock option awards as of December 31, 2010:
Range of
Exercise Prices
Options Outstanding Options Exercisable
Number
Outstanding
12/31/10
Weighted-
Average
Remaining
Contractual
Life (yrs)
Weighted-
Average
Exercise
Price
Number
Exercisable
12/31/10
Weighted-
Average
Remaining
Contractual
Life (yrs)
Weighted-
Average
Exercise
Price
$ 9.56 to $10.00 2,475 .1 $ 9.56 2,475 .1 $ 9.56
10.01 to 15.00 8,514 .9 12.24 8,514 .9 12.24
15.01 to 25.00 2,960,361 7.9 17.51 727,331 7.5 18.17
25.01 to 35.00 15,236,238 6.2 31.70 7,635,919 4.1 32.94
35.01 to 44.20 26,482,543 3.8 38.96 24,296,329 3.6 38.63
44,690,131 4.9 35.06 32,670,568 3.8 36.84
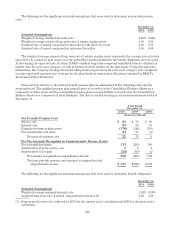
Range of
Exercise Prices
Options Expected to Vest
Number
Outstanding
12/31/10
Weighted-
Average
Remaining
Contractual
Life (yrs)
Weighted-
Average
Exercise
Price
$ 9.56 to $10.00 2,475 .1 $ 9.56
10.01 to 15.00 8,514 .9 12.24
15.01 to 25.00 2,490,702 7.9 17.55
25.01 to 35.00 13,688,667 6.0 31.75
35.01 to 44.20 25,475,869 3.7 38.83
41,666,227 4.7 35.23
The aggregate intrinsic value of options outstanding, options exercisable and options expected to vest at
December 31, 2010 was $26 million, $6 million, and $22 million, respectively.
The following table details the activity during 2010 related to restricted shares and restricted share units
awarded by BB&T:
Year Ended
December 31, 2010
Shares/Units
Wtd. Avg.
Grant Date
Fair Value
Nonvested at beginning of period 10,861,433 $19.36
Granted 3,434,797 23.69
Vested (507,760) 29.73
Forfeited (504,684) 19.97
Nonvested at end of period 13,283,786 20.06
136