BB&T 2010 Annual Report Download - page 126
Download and view the complete annual report
Please find page 126 of the 2010 BB&T annual report below. You can navigate through the pages in the report by either clicking on the pages listed below, or by using the keyword search tool below to find specific information within the annual report.-
 1
1 -
2
-
3
-
4
-
5
-
6
-
7
-
8
-
9
-
10
-
11
-
12
-
13
-
14
-
15
-
16
-
17
-
18
-
19
-
20
-
21
-
22
-
23
-
24
-
25
-
26
-
27
-
28
-
29
-
30
-
31
-
32
-
33
-
34
-
35
-
36
-
37
-
38
-
39
-
40
-
41
-
42
-
43
-
44
-
45
-
46
-
47
-
48
-
49
-
50
-
51
-
52
-
53
-
54
-
55
-
56
-
57
-
58
-
59
-
60
-
61
-
62
-
63
-
64
-
65
-
66
-
67
-
68
-
69
-
70
-
71
-
72
-
73
-
74
-
75
-
76
-
77
-
78
-
79
-
80
-
81
-
82
-
83
-
84
-
85
-
86
-
87
-
88
-
89
-
90
-
91
-
92
-
93
-
94
-
95
-
96
-
97
-
98
-
99
-
100
-
101
-
102
-
103
-
104
-
105
-
106
-
107
-
108
-
109
-
110
-
111
-
112
-
113
-
114
-
115
-
 116
116 -
 117
117 -
 118
118 -
 119
119 -
 120
120 -
 121
121 -
 122
122 -
 123
123 -
 124
124 -
 125
125 -
 126
126 -
 127
127 -
 128
128 -
 129
129 -
 130
130 -
 131
131 -
 132
132 -
 133
133 -
 134
134 -
 135
135 -
 136
136 -
137
-
138
-
139
-
140
-
141
-
142
-
143
-
144
-
145
-
146
-
147
-
148
-
149
-
150
-
151
-
152
-
153
-
154
-
155
-
156
-
157
-
158
-
159
-
160
-
161
-
162
-
163
-
164
-
165
-
166
-
167
-
168
-
169
-
170
-
171
-
172
-
173
-
174
-
175
-
176
-
177
-
178
-
179
-
180
-
181
 |
 |

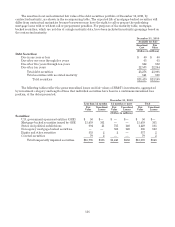
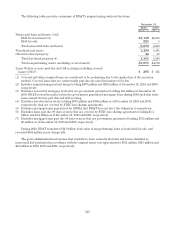
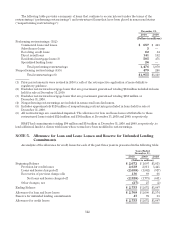
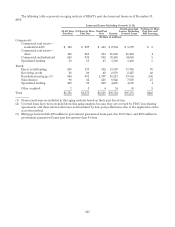
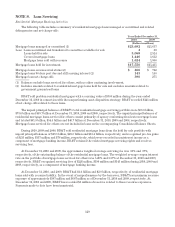
The following tables set forth certain information regarding BB&T’s impaired loans, excluding acquired
impaired loans and loans held for sale, that were evaluated for specific reserves as of December 31, 2010 and 2009:
December 31, 2010
Recorded
Investment
Unpaid
Principal
Balance Related
Allowance
(Dollars in millions)
With No Related Allowance Recorded:
Commercial:
Commercial real estate—residential ADC $ 200 $ 300 $—
Commercial real estate—other 175 246 —
Commercial and industrial 196 267 —
Retail:
Direct retail lending 22 69 —
Residential mortgage (1) 25 50 —
With An Allowance Recorded:
Commercial:
Commercial real estate—residential ADC 484 556 75
Commercial real estate—other 516 565 63
Commercial and industrial 512 534 96
Specialized lending 4 4 1
Retail:
Direct retail lending 155 161 26
Revolving credit 62 61 25
Residential mortgage (1) 663 690 153
Sales finance 551
Specialized lending 24 24 2
Total $3,043 $3,532 $442
(1) Residential mortgage loans exclude $115 million in government guaranteed loans and related allowance of
$14 million.
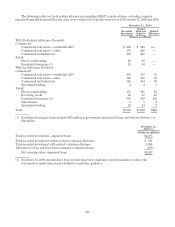
December 31,
2009 (1)
(Dollars in millions)
Total recorded investment—impaired loans $2,305
Total recorded investment with no related valuation allowance $ 611
Total recorded investment with related valuation allowance 1,694
Allowance for loan and lease losses assigned to impaired loans (278)
Net carrying value—impaired loans $2,027
(1) December 31, 2009 amounts have been revised from their originally reported amounts to reflect the
retrospective application of more definitive regulatory guidance.
126