BB&T 2010 Annual Report Download - page 62
Download and view the complete annual report
Please find page 62 of the 2010 BB&T annual report below. You can navigate through the pages in the report by either clicking on the pages listed below, or by using the keyword search tool below to find specific information within the annual report.-
 1
1 -
2
-
3
-
4
-
5
-
6
-
7
-
8
-
9
-
10
-
11
-
12
-
13
-
14
-
15
-
16
-
17
-
18
-
19
-
20
-
21
-
22
-
23
-
24
-
25
-
26
-
27
-
28
-
29
-
30
-
31
-
32
-
33
-
34
-
35
-
36
-
37
-
38
-
39
-
40
-
41
-
42
-
43
-
44
-
45
-
46
-
47
-
48
-
49
-
50
-
51
-
 52
52 -
 53
53 -
 54
54 -
 55
55 -
 56
56 -
 57
57 -
 58
58 -
 59
59 -
 60
60 -
 61
61 -
 62
62 -
 63
63 -
 64
64 -
 65
65 -
 66
66 -
 67
67 -
 68
68 -
 69
69 -
 70
70 -
 71
71 -
 72
72 -
73
-
74
-
75
-
76
-
77
-
78
-
79
-
80
-
81
-
82
-
83
-
84
-
85
-
86
-
87
-
88
-
89
-
90
-
91
-
92
-
93
-
94
-
95
-
96
-
97
-
98
-
99
-
100
-
101
-
102
-
103
-
104
-
105
-
106
-
107
-
108
-
109
-
110
-
111
-
112
-
113
-
114
-
115
-
116
-
117
-
118
-
119
-
120
-
121
-
122
-
123
-
124
-
125
-
126
-
127
-
128
-
129
-
130
-
131
-
132
-
133
-
134
-
135
-
136
-
137
-
138
-
139
-
140
-
141
-
142
-
143
-
144
-
145
-
146
-
147
-
148
-
149
-
150
-
151
-
152
-
153
-
154
-
155
-
156
-
157
-
158
-
159
-
160
-
161
-
162
-
163
-
164
-
165
-
166
-
167
-
168
-
169
-
170
-
171
-
172
-
173
-
174
-
175
-
176
-
177
-
178
-
179
-
180
-
181
 |
 |

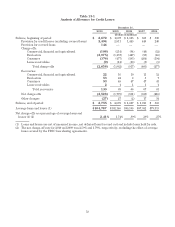
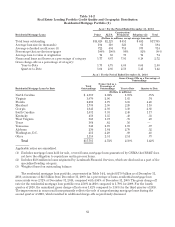
Table 14-2
Real Estate Lending Portfolio Credit Quality and Geographic Distribution
Residential Mortgage Portfolio (1)
As of / For the Period Ended December 31, 2010
Residential Mortgage Loans Prime ALT-A Construction/
Permanent Subprime (2) Total
(Dollars in millions, except average loan size)
Total loans outstanding $14,629 $2,123 $ 551 $ 482 $17,785
Average loan size (in thousands) 194 310 323 61 194
Average refreshed credit score (3) 722 694 714 573 714
Percentage that are first mortgages 100% 100% 99% 82% 99 %
Average loan to value at origination 74 68 73 74 74
Nonaccrual loans and leases as a percentage of category 1.77 6.67 7.95 8.18 2.72
Gross charge-offs as a percentage of category:
Year-to-Date 1.73 4.75 4.68 8.04 2.50
Quarter-to-Date 1.04 2.66 2.56 5.41 1.42
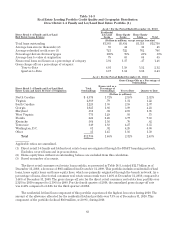
As of / For the Period Ended December 31, 2010
Gross Charge-Offs as a Percentage of
Outstandings
Residential Mortgage Loans by State Total
Outstandings
Nonaccrual as a
Percentage of
Outstandings Year-to-Date Quarter-to-Date
(Dollars in millions)
North Carolina $ 4,319 2.02% 1.19% .75%
Virginia 3,070 2.06 1.65 .74
Florida 2,296 5.79 6.85 4.20
Maryland 1,735 2.30 2.20 1.10
Georgia 1,641 2.93 3.30 2.68
South Carolina 1,631 3.33 2.40 1.17
Kentucky 456 1.35 .48 .33
West Virginia 368 1.37 .75 .49
Texas 364 .42 .16 —
Tennessee 346 2.70 1.19 .87
Alabama 230 1.64 2.70 .32
Washington, D.C. 211 2.29 .69 .48
Other 1,118 2.51 2.14 .73
Total $17,785 2.72% 2.50% 1.42%
Applicable ratios are annualized.
(1) Excludes mortgage loans held for sale, covered loans, mortgage loans guaranteed by GNMA that BB&T does
not have the obligation to repurchase and in process items.
(2) Includes $336 million in loans originated by Lendmark Financial Services, which are disclosed as a part of the
specialized lending category.
(3) Weighted based on outstanding balance.
The residential mortgage loan portfolio, as presented in Table 14-2, totaled $17.8 billion as of December 31,
2010, an increase of $2.1 billion from December 31, 2009. As a percentage of loans, residential mortgage loan
nonaccruals were 2.72% at December 31, 2010, compared with 4.94% at December 31, 2009. The gross charge-off
rate for the residential mortgage loan portfolio was 2.50% in 2010 compared to 1.79% for 2009. For the fourth
quarter of 2010, the annualized gross charge-off rate was 1.42% compared to 1.34% for the third quarter of 2010.
The improvement in nonaccrual loans primarily reflects the sale of nonperforming mortgage loans during the
second quarter of 2010, which resulted in additional charge-offs as previously discussed.
62