BB&T 2010 Annual Report Download - page 116
Download and view the complete annual report
Please find page 116 of the 2010 BB&T annual report below. You can navigate through the pages in the report by either clicking on the pages listed below, or by using the keyword search tool below to find specific information within the annual report.-
 1
1 -
2
-
3
-
4
-
5
-
6
-
7
-
8
-
9
-
10
-
11
-
12
-
13
-
14
-
15
-
16
-
17
-
18
-
19
-
20
-
21
-
22
-
23
-
24
-
25
-
26
-
27
-
28
-
29
-
30
-
31
-
32
-
33
-
34
-
35
-
36
-
37
-
38
-
39
-
40
-
41
-
42
-
43
-
44
-
45
-
46
-
47
-
48
-
49
-
50
-
51
-
52
-
53
-
54
-
55
-
56
-
57
-
58
-
59
-
60
-
61
-
62
-
63
-
64
-
65
-
66
-
67
-
68
-
69
-
70
-
71
-
72
-
73
-
74
-
75
-
76
-
77
-
78
-
79
-
80
-
81
-
82
-
83
-
84
-
85
-
86
-
87
-
88
-
89
-
90
-
91
-
92
-
93
-
94
-
95
-
96
-
97
-
98
-
99
-
100
-
101
-
102
-
103
-
104
-
105
-
 106
106 -
 107
107 -
 108
108 -
 109
109 -
 110
110 -
 111
111 -
 112
112 -
 113
113 -
 114
114 -
 115
115 -
 116
116 -
 117
117 -
 118
118 -
 119
119 -
 120
120 -
 121
121 -
 122
122 -
 123
123 -
 124
124 -
 125
125 -
 126
126 -
127
-
128
-
129
-
130
-
131
-
132
-
133
-
134
-
135
-
136
-
137
-
138
-
139
-
140
-
141
-
142
-
143
-
144
-
145
-
146
-
147
-
148
-
149
-
150
-
151
-
152
-
153
-
154
-
155
-
156
-
157
-
158
-
159
-
160
-
161
-
162
-
163
-
164
-
165
-
166
-
167
-
168
-
169
-
170
-
171
-
172
-
173
-
174
-
175
-
176
-
177
-
178
-
179
-
180
-
181
 |
 |

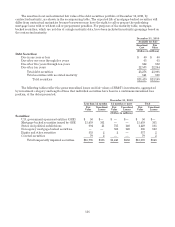
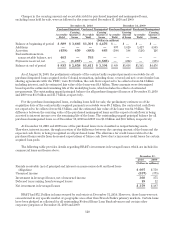
The amortized cost and estimated fair value of the debt securities portfolio at December 31, 2010, by
contractual maturity, are shown in the accompanying table. The expected life of mortgage-backed securities will
differ from contractual maturities because borrowers may have the right to call or prepay the underlying
mortgage loans with or without call or prepayment penalties. For purposes of the maturity table, mortgage-
backed securities, which are not due at a single maturity date, have been included in maturity groupings based on
the contractual maturity.
December 31, 2010
Available for Sale
Amortized
Cost Fair
Value
(Dollars in millions)
Debt Securities:
Due in one year or less $ 60 $ 60
Due after one year through five years 63 65
Due after five years through ten years 622 632
Due after ten years 22,533 22,244
Total debt securities 23,278 23,001
Total securities with no stated maturity 141 168
Total securities $23,419 $23,169
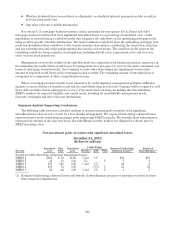
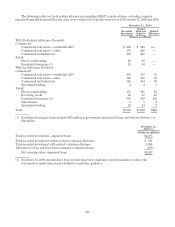
The following tables reflect the gross unrealized losses and fair values of BB&T’s investments, aggregated
by investment category and length of time that individual securities have been in a continuous unrealized loss
position, at the dates presented.
December 31, 2010
Less than 12 months 12 months or more Total
Fair
Value Unrealized
Losses Fair
Value Unrealized
Losses Fair
Value Unrealized
Losses
(Dollars in millions)
Securities:
U.S. government-sponsored entities (GSE) $ 50 $— $ — $— $ 50 $—
Mortgage-backed securities issued by GSE 15,438 361 — — 15,438 361
States and political subdivisions 694 21 735 140 1,429 161
Non-agency mortgage-backed securities — — 506 120 506 120
Equity and other securities 535 2 2 — 537 2
Covered securities 79 2 — — 79 2
Total temporarily impaired securities $16,796 $386 $1,243 $260 $18,039 $646
116