BB&T 2010 Annual Report Download - page 80
Download and view the complete annual report
Please find page 80 of the 2010 BB&T annual report below. You can navigate through the pages in the report by either clicking on the pages listed below, or by using the keyword search tool below to find specific information within the annual report.-
 1
1 -
2
-
3
-
4
-
5
-
6
-
7
-
8
-
9
-
10
-
11
-
12
-
13
-
14
-
15
-
16
-
17
-
18
-
19
-
20
-
21
-
22
-
23
-
24
-
25
-
26
-
27
-
28
-
29
-
30
-
31
-
32
-
33
-
34
-
35
-
36
-
37
-
38
-
39
-
40
-
41
-
42
-
43
-
44
-
45
-
46
-
47
-
48
-
49
-
50
-
51
-
52
-
53
-
54
-
55
-
56
-
57
-
58
-
59
-
60
-
61
-
62
-
63
-
64
-
65
-
66
-
67
-
68
-
69
-
 70
70 -
 71
71 -
 72
72 -
 73
73 -
 74
74 -
 75
75 -
 76
76 -
 77
77 -
 78
78 -
 79
79 -
 80
80 -
 81
81 -
 82
82 -
 83
83 -
 84
84 -
 85
85 -
 86
86 -
 87
87 -
 88
88 -
 89
89 -
 90
90 -
91
-
92
-
93
-
94
-
95
-
96
-
97
-
98
-
99
-
100
-
101
-
102
-
103
-
104
-
105
-
106
-
107
-
108
-
109
-
110
-
111
-
112
-
113
-
114
-
115
-
116
-
117
-
118
-
119
-
120
-
121
-
122
-
123
-
124
-
125
-
126
-
127
-
128
-
129
-
130
-
131
-
132
-
133
-
134
-
135
-
136
-
137
-
138
-
139
-
140
-
141
-
142
-
143
-
144
-
145
-
146
-
147
-
148
-
149
-
150
-
151
-
152
-
153
-
154
-
155
-
156
-
157
-
158
-
159
-
160
-
161
-
162
-
163
-
164
-
165
-
166
-
167
-
168
-
169
-
170
-
171
-
172
-
173
-
174
-
175
-
176
-
177
-
178
-
179
-
180
-
181
 |
 |

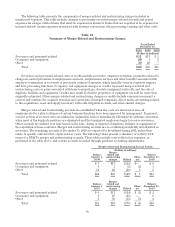
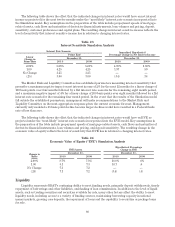
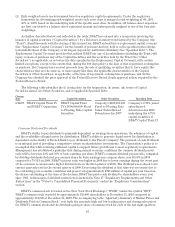
The following table shows the effect that the indicated changes in interest rates would have on net interest
income as projected for the next twelve months under the “most likely” interest rate scenario incorporated into
the Simulation model. Key assumptions in the preparation of the table include prepayment speeds of mortgage-
related assets, cash flows and maturities of derivative financial instruments, loan volumes and pricing, deposit
sensitivity, customer preferences and capital plans. The resulting change in interest sensitive income reflects the
level of sensitivity that interest sensitive income has in relation to changing interest rates.
Table 23
Interest Sensitivity Simulation Analysis
Interest Rate Scenario Annualized Hypothetical
Percentage Change in Net Interest Income
Linear
Change in
Prime Rate
Prime Rate
December 31, December 31,
2010 2009 2010 2009
2.00% 5.25% 5.25% 4.19% 1.60%
1.00 4.25 4.25 1.97 .59
No Change 3.25 3.25 — —
(.25) 3.00 3.00 (.34) .38
The Market Risk and Liquidity Committee has established parameters measuring interest sensitivity that
prescribe a maximum negative impact on net interest income of 2% for the next 12 months for a linear change of
100 basis points over four months followed by a flat interest rate scenario for the remaining eight month period,
and a maximum negative impact of 4% for a linear change of 200 basis points over eight months followed by a flat
interest rate scenario for the remaining four month period. In the event that the results of the Simulation model
fall outside the established parameters, management will make recommendations to the Market Risk and
Liquidity Committee on the most appropriate response given the current economic forecast. Management
currently only modeled a 25 basis point decline because larger declines would have resulted in a Federal funds
rate of less than zero.
The following table shows the effect that the indicated changes in interest rates would have on EVE as
projected under the “most likely” interest rate scenario incorporated into the EVE model. Key assumptions in
the preparation of the table include prepayment speeds of mortgage-related assets, cash flows and maturities of
derivative financial instruments, loan volumes and pricing, and deposit sensitivity. The resulting change in the
economic value of equity reflects the level of sensitivity that EVE has in relation to changing interest rates.
Table 24
Economic Value of Equity (“EVE”) Simulation Analysis
Change in
Rates
EVE/Assets Hypothetical Percentage
Change in EVE
December 31, December 31,
2010 2009 2010 2009
2.00% 8.7% 7.3% 18.8% .6%
1.00 8.1 7.3 10.7 .6
No Change 7.3 7.2 — —
(.25) 7.1 7.2 (3.4) (.5)
Liquidity
Liquidity represents BB&T’s continuing ability to meet funding needs, primarily deposit withdrawals, timely
repayment of borrowings and other liabilities, and funding of loan commitments. In addition to the level of liquid
assets, such as trading securities and securities available for sale, many other factors affect the ability to meet
liquidity needs, including access to a variety of funding sources, maintaining borrowing capacity in national
money markets, growing core deposits, the repayment of loans and the capability to securitize or package loans
for sale.
80