BB&T 2010 Annual Report Download - page 49
Download and view the complete annual report
Please find page 49 of the 2010 BB&T annual report below. You can navigate through the pages in the report by either clicking on the pages listed below, or by using the keyword search tool below to find specific information within the annual report.-
 1
1 -
2
-
3
-
4
-
5
-
6
-
7
-
8
-
9
-
10
-
11
-
12
-
13
-
14
-
15
-
16
-
17
-
18
-
19
-
20
-
21
-
22
-
23
-
24
-
25
-
26
-
27
-
28
-
29
-
30
-
31
-
32
-
33
-
34
-
35
-
36
-
37
-
38
-
 39
39 -
 40
40 -
 41
41 -
 42
42 -
 43
43 -
 44
44 -
 45
45 -
 46
46 -
 47
47 -
 48
48 -
 49
49 -
 50
50 -
 51
51 -
 52
52 -
 53
53 -
 54
54 -
 55
55 -
 56
56 -
 57
57 -
 58
58 -
 59
59 -
60
-
61
-
62
-
63
-
64
-
65
-
66
-
67
-
68
-
69
-
70
-
71
-
72
-
73
-
74
-
75
-
76
-
77
-
78
-
79
-
80
-
81
-
82
-
83
-
84
-
85
-
86
-
87
-
88
-
89
-
90
-
91
-
92
-
93
-
94
-
95
-
96
-
97
-
98
-
99
-
100
-
101
-
102
-
103
-
104
-
105
-
106
-
107
-
108
-
109
-
110
-
111
-
112
-
113
-
114
-
115
-
116
-
117
-
118
-
119
-
120
-
121
-
122
-
123
-
124
-
125
-
126
-
127
-
128
-
129
-
130
-
131
-
132
-
133
-
134
-
135
-
136
-
137
-
138
-
139
-
140
-
141
-
142
-
143
-
144
-
145
-
146
-
147
-
148
-
149
-
150
-
151
-
152
-
153
-
154
-
155
-
156
-
157
-
158
-
159
-
160
-
161
-
162
-
163
-
164
-
165
-
166
-
167
-
168
-
169
-
170
-
171
-
172
-
173
-
174
-
175
-
176
-
177
-
178
-
179
-
180
-
181
 |
 |

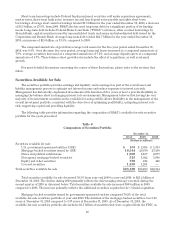
(3) Weighted-average yield excludes the effect of pay-fixed swaps hedging municipal securities.
(4) Securities with no stated maturity include equity investments that totaled $155 million and certain municipal
investments that totaled $13 million.
The fully taxable-equivalent (“FTE”) yield on the total securities portfolio was 3.89% for the year ended
December 31, 2010 compared to 4.41% for the prior year. The yield on mortgage-backed securities issued by
government-sponsored entities decreased from 4.14% to 3.24%, the FTE yield on state and municipal securities
decreased from 5.67% last year to 5.49% in the current year and the yield on U.S. government-sponsored entity
securities decreased from 3.86% in 2009 to 3.67% in 2010. The decrease in the annualized FTE yield on the
average securities portfolio was primarily the result of reinvesting securities sales into securities with shorter
durations and lower yields. Partially offsetting these declines, the FTE yield benefited from the securities
acquired in the Colonial transaction, which were outstanding for the full year 2010 compared to a partial year in
2009.
Loans and Leases
BB&T emphasizes commercial lending to small and medium-sized businesses, consumer lending, mortgage
lending and specialized lending with an overall goal of maximizing the profitability of the loan portfolio while
maintaining strong asset quality. The various categories of loan products offered by BB&T are discussed under
“Lending Activities” in the “Overview and Description of Business” section herein. BB&T is a full-service lender
with approximately one-half of its loan portfolio to businesses and one-half to individual consumers. BB&T’s loan
portfolio, excluding loans held for sale, decreased slightly compared to year-end 2009. This decrease includes a
decline of $1.8 billion in covered loans acquired as part of the Colonial transaction. All covered loans are covered
by one of the FDIC loss sharing agreements as further discussed in Note 2 to the consolidated financial
statements. Average total loans and leases for 2010 increased $2.6 billion, or 2.6%, compared to 2009. The growth
in the average loan portfolio included an increase of $5.3 billion as a result of the Colonial acquisition during 2009.
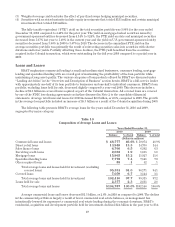
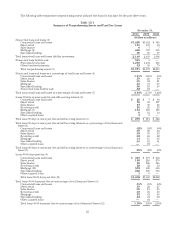
The following table presents BB&T’s average loans for the years ended December 31, 2010 and 2009,
segregated by major category:
Table 10
Composition of Average Loans and Leases
Years Ended December 31,
2010 2009
Balance % of total Balance % of total
(Dollars in millions)
Commercial loans and leases $ 48,777 46.6% $ 50,074 48.9%
Direct retail loans 13,948 13.3 14,730 14.4
Sales finance loans 6,766 6.5 6,392 6.3
Revolving credit loans 2,032 1.9 1,855 1.8
Mortgage loans 15,965 15.2 15,927 15.6
Specialized lending loans 7,778 7.4 7,141 7.0
Other acquired loans 85 .1 52 .1
Total average loans and leases held for investment (excluding
covered loans) 95,351 91.0 96,171 94.1
Covered loans 7,059 6.7 3,144 3.1
Total average loans and leases held for investment 102,410 97.7 99,315 97.2
Loans held for sale 2,377 2.3 2,831 2.8
Total average loans and leases $104,787 100.0% $102,146 100.0%
Average commercial loans and leases decreased $1.3 billion, or 2.6%, in 2010 as compared to 2009. The decline
in the commercial portfolio is largely a result of lower commercial real estate balances, as management has
intentionally lowered its exposures to commercial real estate lending during the economic downturn. BB&T’s
residential, acquisition and development portfolio held for investment declined $2.4 billion in the past year to $3.4
49