BB&T 2010 Annual Report Download - page 159
Download and view the complete annual report
Please find page 159 of the 2010 BB&T annual report below. You can navigate through the pages in the report by either clicking on the pages listed below, or by using the keyword search tool below to find specific information within the annual report.-
 1
1 -
2
-
3
-
4
-
5
-
6
-
7
-
8
-
9
-
10
-
11
-
12
-
13
-
14
-
15
-
16
-
17
-
18
-
19
-
20
-
21
-
22
-
23
-
24
-
25
-
26
-
27
-
28
-
29
-
30
-
31
-
32
-
33
-
34
-
35
-
36
-
37
-
38
-
39
-
40
-
41
-
42
-
43
-
44
-
45
-
46
-
47
-
48
-
49
-
50
-
51
-
52
-
53
-
54
-
55
-
56
-
57
-
58
-
59
-
60
-
61
-
62
-
63
-
64
-
65
-
66
-
67
-
68
-
69
-
70
-
71
-
72
-
73
-
74
-
75
-
76
-
77
-
78
-
79
-
80
-
81
-
82
-
83
-
84
-
85
-
86
-
87
-
88
-
89
-
90
-
91
-
92
-
93
-
94
-
95
-
96
-
97
-
98
-
99
-
100
-
101
-
102
-
103
-
104
-
105
-
106
-
107
-
108
-
109
-
110
-
111
-
112
-
113
-
114
-
115
-
116
-
117
-
118
-
119
-
120
-
121
-
122
-
123
-
124
-
125
-
126
-
127
-
128
-
129
-
130
-
131
-
132
-
133
-
134
-
135
-
136
-
137
-
138
-
139
-
140
-
141
-
142
-
143
-
144
-
145
-
146
-
147
-
148
-
 149
149 -
 150
150 -
 151
151 -
 152
152 -
 153
153 -
 154
154 -
 155
155 -
 156
156 -
 157
157 -
 158
158 -
 159
159 -
 160
160 -
 161
161 -
 162
162 -
 163
163 -
 164
164 -
 165
165 -
 166
166 -
 167
167 -
 168
168 -
 169
169 -
170
-
171
-
172
-
173
-
174
-
175
-
176
-
177
-
178
-
179
-
180
-
181
 |
 |

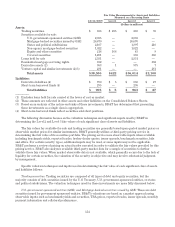
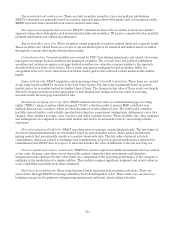
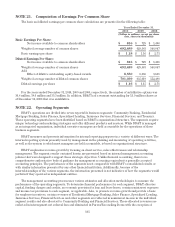
Loans receivable: The fair values for loans are estimated using discounted cash flow analyses, applying
interest rates currently being offered for loans with similar terms and credit quality. The interest rates being
offered by BB&T for new loans with similar terms and credit quality are reflective of credit risk and liquidity
spreads inherent in an orderly transaction in the current market. For commercial loans and leases, internal credit
risk models are used to adjust discount rates for risk migration and expected losses. For residential mortgage and
other consumer loans, internal prepayment risk models are used to adjust contractual cash flows. Loans are
aggregated into pools of similar terms and credit quality and discounted using a LIBOR based rate. The carrying
amounts of accrued interest approximate fair values.
Deposit liabilities: The fair values for demand deposits, interest-checking accounts, savings accounts and
certain money market accounts are, by definition, equal to the amount payable on demand at the reporting date.
Fair values for certificates of deposit are estimated using a discounted cash flow calculation that applies current
interest rates to aggregate expected maturities. In addition, nonfinancial instruments such as core deposit
intangibles are not recorded at fair value. BB&T has developed long-term relationships with its customers
through its deposit base and in the opinion of management, these items add significant value to BB&T.
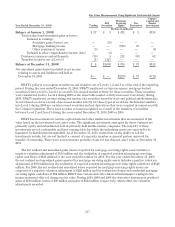
Federal funds purchased, securities sold under repurchase agreements and short-term borrowed funds: The
carrying amounts of Federal funds purchased, borrowings under repurchase agreements and short-term
borrowed funds approximate their fair values.
Long-term debt: The fair values of long-term debt are estimated based on quoted market prices for the
instrument if available, or for similar instruments if not available, or by using discounted cash flow analyses,
based on BB&T’s current incremental borrowing rates for similar types of instruments.
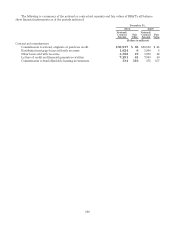
Contractual commitments: The fair values of commitments are estimated using the fees charged to enter
into similar agreements, taking into account the remaining terms of the agreements and the present
creditworthiness of the counterparties. For fixed-rate loan commitments, fair values also consider the difference
between current levels of interest rates and the committed rates. The fair values of guarantees and letters of
credit are estimated based on the counterparties’ creditworthiness and average default rates for loan products
with similar risks. The fair values of commitments to fund affordable housing investments are estimated using
the net present value of future commitments.
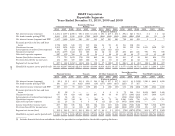
The following is a summary of the carrying amounts and fair values of those financial assets and liabilities
that BB&T has not recorded at fair value:
December 31,
2010 2009
Carrying
Amount Fair Value Carrying
Amount Fair
Value
(Dollars in millions)
Financial assets:
Loans and leases (1)(2) $101,380 $100,360 $101,056 $100,794
Financial liabilities:
Deposits 107,213 104,091 114,965 112,917
Long-term debt 21,730 22,733 21,376 21,018
(1) Includes loans held for sale carried at the lower of cost or market.
(2) The carrying value is net of the allowance for loan and lease losses.
159