BB&T 2010 Annual Report Download - page 94
Download and view the complete annual report
Please find page 94 of the 2010 BB&T annual report below. You can navigate through the pages in the report by either clicking on the pages listed below, or by using the keyword search tool below to find specific information within the annual report.-
 1
1 -
2
-
3
-
4
-
5
-
6
-
7
-
8
-
9
-
10
-
11
-
12
-
13
-
14
-
15
-
16
-
17
-
18
-
19
-
20
-
21
-
22
-
23
-
24
-
25
-
26
-
27
-
28
-
29
-
30
-
31
-
32
-
33
-
34
-
35
-
36
-
37
-
38
-
39
-
40
-
41
-
42
-
43
-
44
-
45
-
46
-
47
-
48
-
49
-
50
-
51
-
52
-
53
-
54
-
55
-
56
-
57
-
58
-
59
-
60
-
61
-
62
-
63
-
64
-
65
-
66
-
67
-
68
-
69
-
70
-
71
-
72
-
73
-
74
-
75
-
76
-
77
-
78
-
79
-
80
-
81
-
82
-
83
-
 84
84 -
 85
85 -
 86
86 -
 87
87 -
 88
88 -
 89
89 -
 90
90 -
 91
91 -
 92
92 -
 93
93 -
 94
94 -
 95
95 -
 96
96 -
 97
97 -
 98
98 -
 99
99 -
 100
100 -
 101
101 -
 102
102 -
 103
103 -
 104
104 -
105
-
106
-
107
-
108
-
109
-
110
-
111
-
112
-
113
-
114
-
115
-
116
-
117
-
118
-
119
-
120
-
121
-
122
-
123
-
124
-
125
-
126
-
127
-
128
-
129
-
130
-
131
-
132
-
133
-
134
-
135
-
136
-
137
-
138
-
139
-
140
-
141
-
142
-
143
-
144
-
145
-
146
-
147
-
148
-
149
-
150
-
151
-
152
-
153
-
154
-
155
-
156
-
157
-
158
-
159
-
160
-
161
-
162
-
163
-
164
-
165
-
166
-
167
-
168
-
169
-
170
-
171
-
172
-
173
-
174
-
175
-
176
-
177
-
178
-
179
-
180
-
181
 |
 |

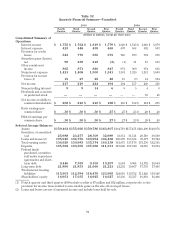
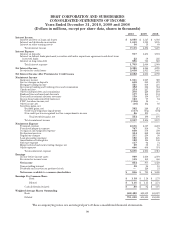
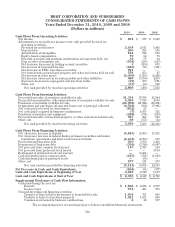
Table 32
Quarterly Financial Summary—Unaudited
2010 2009
Fourth
Quarter Third
Quarter Second
Quarter First
Quarter Fourth
Quarter Third
Quarter Second
Quarter First
Quarter
(Dollars in millions, except per share data)
Consolidated Summary of
Operations:
Interest income $ 1,755 $ 1,762 $ 1,819 $ 1,779 $ 1,820 $ 1,745 $ 1,640 $ 1,679
Interest expense 423 448 459 465 497 508 502 533
Provision for credit
losses 643 770 650 575 725 709 701 676
Securities gains (losses),
net 99 239 219 (3) (1) 31 19 150
Other noninterest
income 865 871 820 847 971 909 974 881
Noninterest expense 1,421 1,408 1,500 1,341 1,361 1,320 1,181 1,069
Provision for income
taxes (1) 15 27 25 48 13 (9) 41 114
Net income 217 219 224 194 194 157 208 318
Noncontrolling interest 9 9 14 6 9546
Dividends and accretion
on preferred stock ————— — 83 41
Net income available to
common shareholders $ 208 $ 210 $ 210 $ 188 $ 185 $ 152 $ 121 $ 271
Basic earnings per
common share $ .30 $ .30 $ .30 $ .27 $ .27 $ .23 $ .20 $ .48
Diluted earnings per
common share $ .30 $ .30 $ .30 $ .27 $ .27 $ .23 $ .20 $ .48
Selected Average Balances:
Assets $159,464 $155,666 $159,786 $163,807 $164,719 $157,451 $148,496 $149,876
Securities, at amortized
cost 25,988 23,277 28,309 32,989 33,351 31,511 29,510 30,500
Loans and leases (2) 105,946 104,755 103,964 104,468 105,869 103,334 99,577 99,724
Total earning assets 134,929 130,983 135,374 140,138 141,875 137,176 131,156 132,331
Deposits 105,592 103,505 107,060 111,031 113,622 107,310 94,385 93,934
Federal funds
purchased, securities
sold under repurchase
agreements and short-
term debt 9,446 7,355 9,105 10,207 8,584 9,964 14,732 16,804
Long-term debt 21,890 21,833 21,660 21,221 21,232 19,867 17,755 17,436
Total interest-bearing
liabilities 115,901 112,594 118,479 123,995 124,616 119,752 111,429 114,346
Shareholders’ equity 16,951 17,035 16,925 16,627 16,336 15,537 16,683 16,406
(1) Fourth quarter and third quarter 2009 include credits of $7 million and $12 million, respectively, to the
provision for income taxes related to non-taxable gains on the sale of leveraged leases.
(2) Loans and leases are net of unearned income and include loans held for sale.
94