BB&T 2010 Annual Report Download - page 86
Download and view the complete annual report
Please find page 86 of the 2010 BB&T annual report below. You can navigate through the pages in the report by either clicking on the pages listed below, or by using the keyword search tool below to find specific information within the annual report.-
 1
1 -
2
-
3
-
4
-
5
-
6
-
7
-
8
-
9
-
10
-
11
-
12
-
13
-
14
-
15
-
16
-
17
-
18
-
19
-
20
-
21
-
22
-
23
-
24
-
25
-
26
-
27
-
28
-
29
-
30
-
31
-
32
-
33
-
34
-
35
-
36
-
37
-
38
-
39
-
40
-
41
-
42
-
43
-
44
-
45
-
46
-
47
-
48
-
49
-
50
-
51
-
52
-
53
-
54
-
55
-
56
-
57
-
58
-
59
-
60
-
61
-
62
-
63
-
64
-
65
-
66
-
67
-
68
-
69
-
70
-
71
-
72
-
73
-
74
-
75
-
 76
76 -
 77
77 -
 78
78 -
 79
79 -
 80
80 -
 81
81 -
 82
82 -
 83
83 -
 84
84 -
 85
85 -
 86
86 -
 87
87 -
 88
88 -
 89
89 -
 90
90 -
 91
91 -
 92
92 -
 93
93 -
 94
94 -
 95
95 -
 96
96 -
97
-
98
-
99
-
100
-
101
-
102
-
103
-
104
-
105
-
106
-
107
-
108
-
109
-
110
-
111
-
112
-
113
-
114
-
115
-
116
-
117
-
118
-
119
-
120
-
121
-
122
-
123
-
124
-
125
-
126
-
127
-
128
-
129
-
130
-
131
-
132
-
133
-
134
-
135
-
136
-
137
-
138
-
139
-
140
-
141
-
142
-
143
-
144
-
145
-
146
-
147
-
148
-
149
-
150
-
151
-
152
-
153
-
154
-
155
-
156
-
157
-
158
-
159
-
160
-
161
-
162
-
163
-
164
-
165
-
166
-
167
-
168
-
169
-
170
-
171
-
172
-
173
-
174
-
175
-
176
-
177
-
178
-
179
-
180
-
181
 |
 |

applicable deferred income taxes, and certain nonfinancial equity investments. Tier 2 capital may consist of
qualifying subordinated debt, certain hybrid capital instruments, qualifying preferred stock and a limited amount
of the allowance for credit losses. Tier 1 capital and Tier 2 capital combined are referred to as total regulatory
capital. Tier 1 capital is required to be at least 4% of risk-weighted assets, and total capital must be at least 8% of
risk-weighted assets, with one half of the minimum consisting of Tier 1 capital.
Current provisions of the Dodd-Frank Act will result in the elimination, over a manageable period of time, of
certain capital securities from inclusion in Tier 1 capital. BB&T currently has approximately $3.2 billion of capital
securities that qualify as Tier 1 capital. In addition, as discussed in the section titled “Regulatory
Considerations”, the regulators are currently evaluating the adoption of new Basel III capital standards. Based
on a review of the proposed standards, management believes it will meet the required capital levels. As of
December 31, 2010, management’s current projection of Tier 1 common under Basel III was 7.5%.
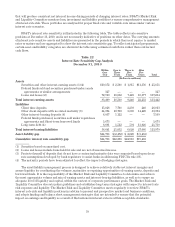
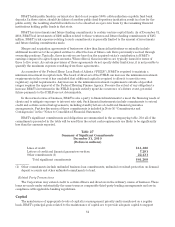
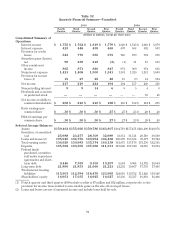
In addition to the risk-based capital measures described above, regulators have also established minimum
leverage capital requirements for banking organizations. The minimum required Tier 1 leverage ratio ranges
from 3% to 5% depending upon Federal bank regulatory agency evaluations of an organization’s overall safety
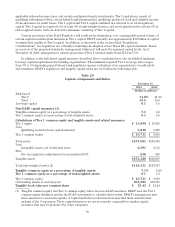
and soundness. BB&T’s regulatory and tangible capital ratios are set forth in the following table.
Table 29
Capital—Components and Ratios
December 31,
2010 2009
(Dollars in millions)
Risk-based:
Tier 1 11.8% 11.5%
Total 15.5 15.8
Leverage capital 9.1 8.5
Non-GAAP capital measures (1)
Tangible common equity as a percentage of tangible assets 7.1 6.2
Tier 1 common equity as a percentage of risk-weighted assets 9.1 8.5
Calculations of Tier 1 common equity and tangible assets and related measures:
Tier 1 equity $ 13,959 $ 13,456
Less:
Qualifying restricted core capital elements 3,248 3,497
Tier 1 common equity $ 10,711 $ 9,959
Total assets $157,081 $165,764
Less:
Intangible assets, net of deferred taxes 6,391 6,553
Plus:
Pre-tax regulatory adjustments for accumulated OCI 636 806
Tangible assets $151,326 $160,017
Total risk-weighted assets (2) $118,131 $117,167
Tangible common equity as a percentage of tangible assets 7.1% 6.2%
Tier 1 common equity as a percentage of risk-weighted assets 9.1 8.5
Tier 1 common equity $ 10,711 $ 9,959
Outstanding shares at end of period 694,381 689,750
Tangible book value per common share $ 15.43 $ 14.44
(1) Tangible common equity and Tier 1 common equity ratios are non-GAAP measures. BB&T uses the Tier 1
common equity definition used in the SCAP assessment to calculate these ratios. BB&T's management uses
these measures to assess the quality of capital and believes that investors may find them useful in their
analysis of the Corporation. These capital measures are not necessarily comparable to similar capital
measures that may be presented by other companies.
86