BB&T 2010 Annual Report Download - page 142
Download and view the complete annual report
Please find page 142 of the 2010 BB&T annual report below. You can navigate through the pages in the report by either clicking on the pages listed below, or by using the keyword search tool below to find specific information within the annual report.-
 1
1 -
2
-
3
-
4
-
5
-
6
-
7
-
8
-
9
-
10
-
11
-
12
-
13
-
14
-
15
-
16
-
17
-
18
-
19
-
20
-
21
-
22
-
23
-
24
-
25
-
26
-
27
-
28
-
29
-
30
-
31
-
32
-
33
-
34
-
35
-
36
-
37
-
38
-
39
-
40
-
41
-
42
-
43
-
44
-
45
-
46
-
47
-
48
-
49
-
50
-
51
-
52
-
53
-
54
-
55
-
56
-
57
-
58
-
59
-
60
-
61
-
62
-
63
-
64
-
65
-
66
-
67
-
68
-
69
-
70
-
71
-
72
-
73
-
74
-
75
-
76
-
77
-
78
-
79
-
80
-
81
-
82
-
83
-
84
-
85
-
86
-
87
-
88
-
89
-
90
-
91
-
92
-
93
-
94
-
95
-
96
-
97
-
98
-
99
-
100
-
101
-
102
-
103
-
104
-
105
-
106
-
107
-
108
-
109
-
110
-
111
-
112
-
113
-
114
-
115
-
116
-
117
-
118
-
119
-
120
-
121
-
122
-
123
-
124
-
125
-
126
-
127
-
128
-
129
-
130
-
131
-
 132
132 -
 133
133 -
 134
134 -
 135
135 -
 136
136 -
 137
137 -
 138
138 -
 139
139 -
 140
140 -
 141
141 -
 142
142 -
 143
143 -
 144
144 -
 145
145 -
 146
146 -
 147
147 -
 148
148 -
 149
149 -
 150
150 -
 151
151 -
 152
152 -
153
-
154
-
155
-
156
-
157
-
158
-
159
-
160
-
161
-
162
-
163
-
164
-
165
-
166
-
167
-
168
-
169
-
170
-
171
-
172
-
173
-
174
-
175
-
176
-
177
-
178
-
179
-
180
-
181
 |
 |

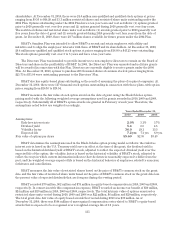
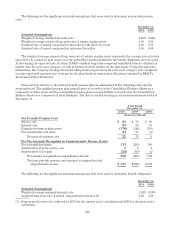
The following are the significant actuarial assumptions that were used to determine net periodic pension
costs:
December 31,
2010 2009
Actuarial Assumptions
Weighted average assumed discount rate 6.16% 6.20%
Weighted average expected long-term rate of return on plan assets 8.00 8.00
Assumed rate of annual compensation increases for the first two years 2.50 2.50
Assumed rate of annual compensation increases thereafter 4.50 4.50
The weighted average expected long-term rate of return on plan assets represents the average rate of return
expected to be earned on plan assets over the period the benefits included in the benefit obligation are to be paid.
In developing the expected rate of return, BB&T considers long-term compound annualized returns of historical
market data for each asset category, as well as historical actual returns on the plan assets. Using this reference
information, the Company develops forward-looking return expectations for each asset category and a weighted
average expected long-term rate of return for the plan based on target asset allocations contained in BB&T’s
Investment Policy Statement.
Financial data relative to the defined benefit pension plans is summarized in the following tables for the
years indicated. The qualified pension plan prepaid asset is recorded on the Consolidated Balance Sheets as a
component of other assets and the nonqualified pension plans accrued liability is recorded on the Consolidated
Balance Sheets as a component of other liabilities. The data is calculated using an actuarial measurement date of
December 31.
Years Ended
December 31,
2010 2009 2008
(Dollars in millions)
Net Periodic Pension Cost
Service cost $83 $76 $69
Interest cost 93 86 81
Estimated return on plan assets (178) (144) (139)
Net amortization and other 24 58 (2)
Net periodic pension cost 22 76 9
Pre-Tax Amounts Recognized in Comprehensive Income (Loss)
Net actuarial loss (gain) 133 (228) 590
Amortization of prior service cost 124
Amortization of net gain (25) (60) (2)
Net amount recognized in comprehensive income 109 (286) 592
Total net periodic pension costs (income) recognized in total
comprehensive income $ 131 $(210) $ 601
The following are the significant actuarial assumptions that were used to determine benefit obligations:
December 31,
2010 2009
Actuarial Assumptions
Weighted average assumed discount rate 5.52% 6.16%
Assumed long-term rate of annual compensation increases (1) 4.50 4.50
(1) Represents the rate to be achieved by 2015 for the current year’s calculation and 2011 for the prior year’s
calculation.
142