BB&T 2010 Annual Report Download - page 55
Download and view the complete annual report
Please find page 55 of the 2010 BB&T annual report below. You can navigate through the pages in the report by either clicking on the pages listed below, or by using the keyword search tool below to find specific information within the annual report.-
 1
1 -
2
-
3
-
4
-
5
-
6
-
7
-
8
-
9
-
10
-
11
-
12
-
13
-
14
-
15
-
16
-
17
-
18
-
19
-
20
-
21
-
22
-
23
-
24
-
25
-
26
-
27
-
28
-
29
-
30
-
31
-
32
-
33
-
34
-
35
-
36
-
37
-
38
-
39
-
40
-
41
-
42
-
43
-
44
-
 45
45 -
 46
46 -
 47
47 -
 48
48 -
 49
49 -
 50
50 -
 51
51 -
 52
52 -
 53
53 -
 54
54 -
 55
55 -
 56
56 -
 57
57 -
 58
58 -
 59
59 -
 60
60 -
 61
61 -
 62
62 -
 63
63 -
 64
64 -
 65
65 -
66
-
67
-
68
-
69
-
70
-
71
-
72
-
73
-
74
-
75
-
76
-
77
-
78
-
79
-
80
-
81
-
82
-
83
-
84
-
85
-
86
-
87
-
88
-
89
-
90
-
91
-
92
-
93
-
94
-
95
-
96
-
97
-
98
-
99
-
100
-
101
-
102
-
103
-
104
-
105
-
106
-
107
-
108
-
109
-
110
-
111
-
112
-
113
-
114
-
115
-
116
-
117
-
118
-
119
-
120
-
121
-
122
-
123
-
124
-
125
-
126
-
127
-
128
-
129
-
130
-
131
-
132
-
133
-
134
-
135
-
136
-
137
-
138
-
139
-
140
-
141
-
142
-
143
-
144
-
145
-
146
-
147
-
148
-
149
-
150
-
151
-
152
-
153
-
154
-
155
-
156
-
157
-
158
-
159
-
160
-
161
-
162
-
163
-
164
-
165
-
166
-
167
-
168
-
169
-
170
-
171
-
172
-
173
-
174
-
175
-
176
-
177
-
178
-
179
-
180
-
181
 |
 |

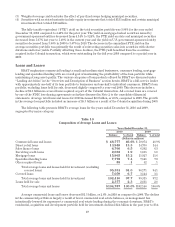
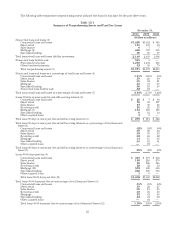
The following table summarizes nonperforming assets and past due loans by loan type for the past three years.
Table 12-1
Summary of Nonperforming Assets and Past Due Loans
December 31,
2010 2009 2008
(Dollars in millions)
Nonaccrual loans and leases (1)
Commercial loans and leases $1,426 $1,651 $ 845
Direct retail 191 197 89
Sales finance 677
Mortgage (2) 466 707 358
Specialized lending 60 96 97
Total nonaccrual loans and leases held for investment 2,149 2,658 1,396
Nonaccrual loans held for sale 521 5—
Foreclosed real estate 1,259 1,451 538
Other foreclosed property 42 58 79
Total nonperforming assets (3) $3,971 $4,172 $2,013
Nonaccrual loans and leases as a percentage of total loans and leases (4)
Commercial loans and leases 1.41% 1.68% .85%
Direct retail .19 .20 .09
Sales finance .01 .01 .01
Mortgage .45 .71 .37
Specialized lending .06 .10 .10
Nonaccrual loans held for sale .52 .01 —
Total nonaccrual loans and leases as a percentage of loans and leases (5) 2.64% 2.71% 1.42%
Loans 90 days or more past due and still accruing interest (6)
Commercial loans and leases $20$7$86
Direct retail 76 82 117
Sales finance 27 30 26
Revolving credit 20 25 23
Mortgage (7) 143 150 158
Specialized lending 612 14
Other acquired loans 35—
Total loans 90 days or more past due and still accruing interest (8) $ 295 $ 311 $ 424
Total loans 90 days or more past due and still accruing interest as a percentage of total loans and
leases (4)
Commercial loans and leases .02% .01% .09%
Direct retail .07 .08 .12
Sales finance .03 .03 .03
Revolving credit .02 .03 .02
Mortgage .14 .15 .16
Specialized lending .01 .01 .01
Other acquired loans —.01 —
Total loans 90 days or more past due and still accruing interest as a percentage of total loans and
leases (9) .29% .32% .43%
Loans 30-89 days past due (6)
Commercial loans and leases $ 315 $ 377 $ 594
Direct retail 189 216 270
Sales finance 95 126 146
Revolving credit 28 32 34
Mortgage (10) 532 600 665
Specialized lending 248 306 313
Other acquired loans 16—
Total loans 30-89 days past due (11) $1,408 $1,663 $2,022
Total loans 30-89 days past due as a percentage of total loans and leases (4)
Commercial loans and leases .31% .38% .60%
Direct retail .19 .22 .27
Sales finance .09 .13 .15
Revolving credit .03 .03 .03
Mortgage .53 .61 .68
Specialized lending .24 .31 .32
Other acquired loans —.01 —
Total loans 30-89 days past due as a percentage of total loans and leases (12) 1.39% 1.69% 2.05%
55