BB&T 2010 Annual Report Download - page 45
Download and view the complete annual report
Please find page 45 of the 2010 BB&T annual report below. You can navigate through the pages in the report by either clicking on the pages listed below, or by using the keyword search tool below to find specific information within the annual report.-
 1
1 -
2
-
3
-
4
-
5
-
6
-
7
-
8
-
9
-
10
-
11
-
12
-
13
-
14
-
15
-
16
-
17
-
18
-
19
-
20
-
21
-
22
-
23
-
24
-
25
-
26
-
27
-
28
-
29
-
30
-
31
-
32
-
33
-
34
-
 35
35 -
 36
36 -
 37
37 -
 38
38 -
 39
39 -
 40
40 -
 41
41 -
 42
42 -
 43
43 -
 44
44 -
 45
45 -
 46
46 -
 47
47 -
 48
48 -
 49
49 -
 50
50 -
 51
51 -
 52
52 -
 53
53 -
 54
54 -
 55
55 -
56
-
57
-
58
-
59
-
60
-
61
-
62
-
63
-
64
-
65
-
66
-
67
-
68
-
69
-
70
-
71
-
72
-
73
-
74
-
75
-
76
-
77
-
78
-
79
-
80
-
81
-
82
-
83
-
84
-
85
-
86
-
87
-
88
-
89
-
90
-
91
-
92
-
93
-
94
-
95
-
96
-
97
-
98
-
99
-
100
-
101
-
102
-
103
-
104
-
105
-
106
-
107
-
108
-
109
-
110
-
111
-
112
-
113
-
114
-
115
-
116
-
117
-
118
-
119
-
120
-
121
-
122
-
123
-
124
-
125
-
126
-
127
-
128
-
129
-
130
-
131
-
132
-
133
-
134
-
135
-
136
-
137
-
138
-
139
-
140
-
141
-
142
-
143
-
144
-
145
-
146
-
147
-
148
-
149
-
150
-
151
-
152
-
153
-
154
-
155
-
156
-
157
-
158
-
159
-
160
-
161
-
162
-
163
-
164
-
165
-
166
-
167
-
168
-
169
-
170
-
171
-
172
-
173
-
174
-
175
-
176
-
177
-
178
-
179
-
180
-
181
 |
 |
challenging economic environment, the excess of the fair value over the carrying value of several reporting units
has narrowed. A continuing period of depressed market conditions, or further market deterioration, may result in
impairment of goodwill in the future.
Pension and Postretirement Benefit Obligations
BB&T offers various pension plans and postretirement benefit plans to employees. The calculation of the
obligations and related expenses under these plans requires the use of actuarial valuation methods and
assumptions. Actuarial assumptions used in the determination of future values of plan assets and liabilities are
subject to management judgment and may differ significantly if different assumptions are used. The discount rate
assumption used to measure the postretirement benefit obligations is set by reference to published high-quality
bond indices, as well as certain hypothetical spot-rate yield curves. These yield curves were constructed from the
underlying bond price and yield data collected as of the plan’s measurement date and are represented by a series
of annualized, individual discount rates with durations ranging from six months to thirty years. Each discount
rate in the curve was derived from an equal weighting of the double A or higher bond universe, apportioned into
distinct maturity groups. For durations where no bond maturities were available, the discount rates for these
maturities were extrapolated based on historical relationships from observable data in similar markets. These
indices and hypothetical curves give only an indication of the appropriate discount rate because the cash flows of
the bonds comprising the indices and curves do not match the projected benefit payment stream of the plan
precisely. For this reason, we also consider the individual characteristics of the plan, such as projected cash flow
patterns and payment durations, when setting the discount rate. Management evaluated the sensitivity changes
in the expected return on plan assets and the discount rate would have on pension expense for 2011. A decrease of
25 basis points in the discount rate would result in an additional pension expense of approximately $12 million for
2011. Based on the balance of plan assets on December 31, 2010, a decrease of one percent in the expected return
on plan assets would result in an increase of approximately $25 million in pension expense for 2011. Please refer
to Note 15 “Benefit Plans” in the “Notes to Consolidated Financial Statements” for disclosures related to BB&T’s
benefit plans.
Income Taxes
The calculation of BB&T’s income tax provision is complex and requires the use of estimates and judgments.
As part of the Company’s analysis and implementation of business strategies, consideration is given to the tax
laws and regulations that apply to the specific facts and circumstances for any tax position under evaluation. For
tax positions that are uncertain in nature, management determines whether the tax position is more likely than
not to be sustained upon examination. For tax positions that meet this threshold, management then estimates the
amount of the tax benefit to recognize in the financial statements. Management closely monitors tax
developments in order to evaluate the effect they may have on the Company’s overall tax position and the
estimates and judgments used in determining the income tax provision and records adjustments as necessary.
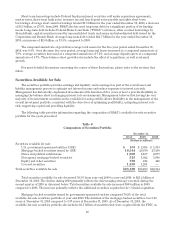
Analysis of Financial Condition
A summary of the more significant fluctuations in balance sheet accounts is presented below.
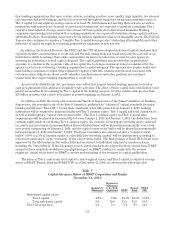
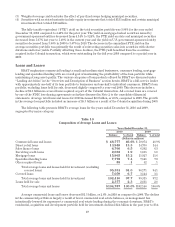
For the year ended December 31, 2010, BB&T’s average assets totaled $159.7 billion, an increase of $4.5
billion, or 2.9%, compared to the 2009 average of $155.2 billion, primarily reflecting growth in average loans and
leases and the FDIC loss share receivable. Average loans and leases for 2010 were up $2.6 billion, or 2.6%, from
2009 and average FDIC loss share receivable increased $1.0 billion compared to 2009. The growth in average
loans and leases included $3.9 billion in average covered loans as a result of the Colonial acquisition, which was
completed on August 14, 2009. Average investment securities decreased $3.6 billion, or 11.6%, compared to 2009
due to the deleveraging strategy, which was completed during the second quarter of 2010. Total earning assets
averaged $135.3 billion in 2010, a decrease of $335 million, or .2%, compared to 2009. These averages and growth
rates include the effects of acquisitions.
BB&T’s average deposits totaled $106.8 billion, reflecting growth of $4.4 billion, or 4.3%, compared to 2009.
The growth in average deposits includes growth of 9.2% from client sources and a decline of 44.2% in wholesale
deposit products. The favorable change was primarily due to the additional deposits assumed in the Colonial
acquisition.
45