BB&T 2010 Annual Report Download - page 88
Download and view the complete annual report
Please find page 88 of the 2010 BB&T annual report below. You can navigate through the pages in the report by either clicking on the pages listed below, or by using the keyword search tool below to find specific information within the annual report.-
 1
1 -
2
-
3
-
4
-
5
-
6
-
7
-
8
-
9
-
10
-
11
-
12
-
13
-
14
-
15
-
16
-
17
-
18
-
19
-
20
-
21
-
22
-
23
-
24
-
25
-
26
-
27
-
28
-
29
-
30
-
31
-
32
-
33
-
34
-
35
-
36
-
37
-
38
-
39
-
40
-
41
-
42
-
43
-
44
-
45
-
46
-
47
-
48
-
49
-
50
-
51
-
52
-
53
-
54
-
55
-
56
-
57
-
58
-
59
-
60
-
61
-
62
-
63
-
64
-
65
-
66
-
67
-
68
-
69
-
70
-
71
-
72
-
73
-
74
-
75
-
76
-
77
-
 78
78 -
 79
79 -
 80
80 -
 81
81 -
 82
82 -
 83
83 -
 84
84 -
 85
85 -
 86
86 -
 87
87 -
 88
88 -
 89
89 -
 90
90 -
 91
91 -
 92
92 -
 93
93 -
 94
94 -
 95
95 -
 96
96 -
 97
97 -
 98
98 -
99
-
100
-
101
-
102
-
103
-
104
-
105
-
106
-
107
-
108
-
109
-
110
-
111
-
112
-
113
-
114
-
115
-
116
-
117
-
118
-
119
-
120
-
121
-
122
-
123
-
124
-
125
-
126
-
127
-
128
-
129
-
130
-
131
-
132
-
133
-
134
-
135
-
136
-
137
-
138
-
139
-
140
-
141
-
142
-
143
-
144
-
145
-
146
-
147
-
148
-
149
-
150
-
151
-
152
-
153
-
154
-
155
-
156
-
157
-
158
-
159
-
160
-
161
-
162
-
163
-
164
-
165
-
166
-
167
-
168
-
169
-
170
-
171
-
172
-
173
-
174
-
175
-
176
-
177
-
178
-
179
-
180
-
181
 |
 |

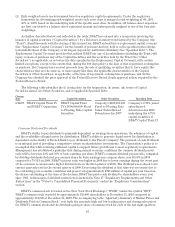
Table 30
Quarterly Summary of Market Prices and Cash Dividends Declared on Common Stock
2010 2009
Sales Prices Cash
Dividends
Declared
Sales Prices Cash
Dividends
DeclaredHigh Low Last High Low Last
Quarter Ended:
March 31 $32.93 $25.40 $32.39 $.15 $27.72 $12.90 $16.92 $.47
June 30 35.72 26.18 26.31 .15 28.67 16.27 21.98 .15
September 30 28.69 21.72 24.08 .15 29.81 19.83 27.24 .15
December 31 27.57 22.15 26.29 .15 28.66 23.75 25.37 .15
Year $35.72 $21.72 $26.29 $.60 $29.81 $12.90 $25.37 $.92
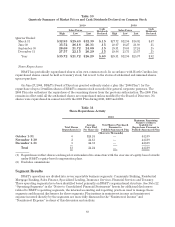
Share Repurchases
BB&T has periodically repurchased shares of its own common stock. In accordance with North Carolina law,
repurchased shares cannot be held as treasury stock, but revert to the status of authorized and unissued shares
upon repurchase.
On June 27, 2006, BB&T’s Board of Directors granted authority under a plan (the “2006 Plan”) for the
repurchase of up to 50 million shares of BB&T’s common stock as needed for general corporate purposes. The
2006 Plan also authorizes the repurchase of the remaining shares from the previous authorization. The 2006 Plan
remains in effect until all the authorized shares are repurchased unless modified by the Board of Directors. No
shares were repurchased in connection with the 2006 Plan during 2010, 2009 and 2008.
Table 31
Share Repurchase Activity
2010
Total Shares
Repurchased (1)
Average
Price Paid
Per Share (2)
Total Shares Purchased
Pursuant to
Publicly-Announced Plan
Maximum Remaining
Number of Shares
Available for
Repurchase Pursuant to
Publicly-Announced Plan
(Shares in Thousands)
October 1-31 6 $24.24 — 44,139
November 1-30 2 24.12 — 44,139
December 1-31 5 24.31 — 44,139
Total 13 24.24 — 44,139
(1) Repurchases reflect shares exchanged or surrendered in connection with the exercise of equity-based awards
under BB&T’s equity-based compensation plans.
(2) Excludes commissions.
Segment Results
BB&T’s operations are divided into seven reportable business segments: Community Banking, Residential
Mortgage Banking, Sales Finance, Specialized Lending, Insurance Services, Financial Services and Treasury.
These operating segments have been identified based primarily on BB&T’s organizational structure. See Note 22
“Operating Segments” in the “Notes to Consolidated Financial Statements” herein for additional disclosures
related to BB&T’s operating segments, the internal accounting and reporting practices used to manage these
segments and financial disclosures for these segments. Fluctuations in noninterest income and noninterest
expense incurred directly by the segments are more fully discussed in the “Noninterest Income” and
“Noninterest Expense” sections of this discussion and analysis.
88