BB&T 2010 Annual Report Download - page 59
Download and view the complete annual report
Please find page 59 of the 2010 BB&T annual report below. You can navigate through the pages in the report by either clicking on the pages listed below, or by using the keyword search tool below to find specific information within the annual report.-
 1
1 -
2
-
3
-
4
-
5
-
6
-
7
-
8
-
9
-
10
-
11
-
12
-
13
-
14
-
15
-
16
-
17
-
18
-
19
-
20
-
21
-
22
-
23
-
24
-
25
-
26
-
27
-
28
-
29
-
30
-
31
-
32
-
33
-
34
-
35
-
36
-
37
-
38
-
39
-
40
-
41
-
42
-
43
-
44
-
45
-
46
-
47
-
48
-
 49
49 -
 50
50 -
 51
51 -
 52
52 -
 53
53 -
 54
54 -
 55
55 -
 56
56 -
 57
57 -
 58
58 -
 59
59 -
 60
60 -
 61
61 -
 62
62 -
 63
63 -
 64
64 -
 65
65 -
 66
66 -
 67
67 -
 68
68 -
 69
69 -
70
-
71
-
72
-
73
-
74
-
75
-
76
-
77
-
78
-
79
-
80
-
81
-
82
-
83
-
84
-
85
-
86
-
87
-
88
-
89
-
90
-
91
-
92
-
93
-
94
-
95
-
96
-
97
-
98
-
99
-
100
-
101
-
102
-
103
-
104
-
105
-
106
-
107
-
108
-
109
-
110
-
111
-
112
-
113
-
114
-
115
-
116
-
117
-
118
-
119
-
120
-
121
-
122
-
123
-
124
-
125
-
126
-
127
-
128
-
129
-
130
-
131
-
132
-
133
-
134
-
135
-
136
-
137
-
138
-
139
-
140
-
141
-
142
-
143
-
144
-
145
-
146
-
147
-
148
-
149
-
150
-
151
-
152
-
153
-
154
-
155
-
156
-
157
-
158
-
159
-
160
-
161
-
162
-
163
-
164
-
165
-
166
-
167
-
168
-
169
-
170
-
171
-
172
-
173
-
174
-
175
-
176
-
177
-
178
-
179
-
180
-
181
 |
 |

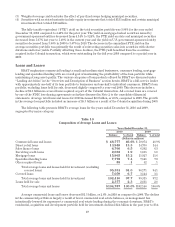
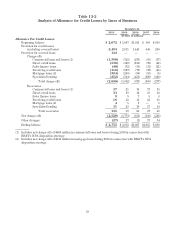
Table 13-2
Analysis of Allowance for Credit Losses by Lines of Business
December 31,
2010 2009 2008 2007 2006
(Dollars in millions)
Allowance For Credit Losses
Beginning balance $ 2,672 $ 1,607 $1,015 $ 888 $ 830
Provision for credit losses
(excluding covered loans) 2,494 2,811 1,445 448 240
Provision for covered loans 144 ————
Charge-offs
Commercial loans and leases (1) (1,508) (720) (276) (65) (37)
Direct retail loans (338) (349) (156) (72) (48)
Sales finance loans (48) (72) (59) (31) (21)
Revolving credit loans (118) (127) (79) (47) (45)
Mortgage loans (2) (394) (280) (96) (10) (6)
Specialized lending (252) (314) (251) (180) (120)
Total charge-offs (2,658) (1,862) (917) (405) (277)
Recoveries
Commercial loans and leases (1) 37 21 16 17 15
Direct retail loans 33 19 12 13 12
Sales finance loans 99788
Revolving credit loans 16 12 11 12 11
Mortgage loans (2) 451—1
Specialized lending 31 23 19 17 14
Total recoveries 130 89 66 67 61
Net charge-offs (2,528) (1,773) (851) (338) (216)
Other changes (27) 27 (2) 17 34
Ending balance $ 2,755 $ 2,672 $1,607 $1,015 $ 888
(1) Includes net charge-offs of $464 million in commercial loans and leases during 2010 in connection with
BB&T’s NPA disposition strategy.
(2) Includes net charge-offs of $141 million in mortgage loans during 2010 in connection with BB&T’s NPA
disposition strategy.
59