BB&T 2010 Annual Report Download - page 135
Download and view the complete annual report
Please find page 135 of the 2010 BB&T annual report below. You can navigate through the pages in the report by either clicking on the pages listed below, or by using the keyword search tool below to find specific information within the annual report.-
 1
1 -
2
-
3
-
4
-
5
-
6
-
7
-
8
-
9
-
10
-
11
-
12
-
13
-
14
-
15
-
16
-
17
-
18
-
19
-
20
-
21
-
22
-
23
-
24
-
25
-
26
-
27
-
28
-
29
-
30
-
31
-
32
-
33
-
34
-
35
-
36
-
37
-
38
-
39
-
40
-
41
-
42
-
43
-
44
-
45
-
46
-
47
-
48
-
49
-
50
-
51
-
52
-
53
-
54
-
55
-
56
-
57
-
58
-
59
-
60
-
61
-
62
-
63
-
64
-
65
-
66
-
67
-
68
-
69
-
70
-
71
-
72
-
73
-
74
-
75
-
76
-
77
-
78
-
79
-
80
-
81
-
82
-
83
-
84
-
85
-
86
-
87
-
88
-
89
-
90
-
91
-
92
-
93
-
94
-
95
-
96
-
97
-
98
-
99
-
100
-
101
-
102
-
103
-
104
-
105
-
106
-
107
-
108
-
109
-
110
-
111
-
112
-
113
-
114
-
115
-
116
-
117
-
118
-
119
-
120
-
121
-
122
-
123
-
124
-
 125
125 -
 126
126 -
 127
127 -
 128
128 -
 129
129 -
 130
130 -
 131
131 -
 132
132 -
 133
133 -
 134
134 -
 135
135 -
 136
136 -
 137
137 -
 138
138 -
 139
139 -
 140
140 -
 141
141 -
 142
142 -
 143
143 -
 144
144 -
 145
145 -
146
-
147
-
148
-
149
-
150
-
151
-
152
-
153
-
154
-
155
-
156
-
157
-
158
-
159
-
160
-
161
-
162
-
163
-
164
-
165
-
166
-
167
-
168
-
169
-
170
-
171
-
172
-
173
-
174
-
175
-
176
-
177
-
178
-
179
-
180
-
181
 |
 |

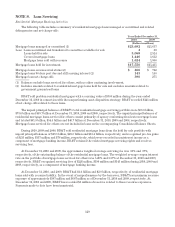
shareholders. At December 31, 2010, there were 24.0 million non-qualified and qualified stock options at prices
ranging from $9.56 to $44.20 and 13.3 million restricted shares and restricted share units outstanding under the
2004 Plan. Options outstanding under the 2004 Plan have a ten year term and vest as follows: (1) options granted
prior to 2010 generally vest over five years and (2) options granted during 2010 generally vest over four years.
The restricted shares and restricted share units vest as follows: (1) awards granted prior to 2010 generally vest
five years from the date of grant and (2) awards granted during 2010 generally vest four years from the date of
grant. At December 31, 2010, there were 20.7 million shares available for future grants under the 2004 Plan.
BB&T’s Omnibus Plan was intended to allow BB&T to recruit and retain employees with ability and
initiative and to align the employees’ interests with those of BB&T and its shareholders. At December 31, 2010,
20.4 million non-qualified and qualified stock options at prices ranging from $16.05 to $43.25 were outstanding.
The stock options generally vest over 3 to 5 years and have a ten-year term.
The Directors’ Plan was intended to provide incentives to non-employee directors to remain on the Board of
Directors and share in the profitability of BB&T. In 2005, the Directors’ Plan was amended and no future grants
will be awarded in connection with this Plan. Directors are currently eligible to receive grants under the 2004
Plan. At December 31, 2010, options to purchase 233 thousand shares of common stock at prices ranging from
$25.75 to $31.80 were outstanding pursuant to the Directors’ Plan.
BB&T also has equity-based plans outstanding as the result of assuming the plans of acquired companies. At
December 31, 2010, there were 117 thousand stock options outstanding in connection with these plans, with option
prices ranging from $26.16 to $29.54.
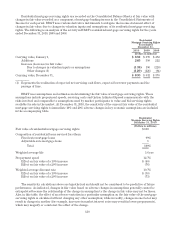
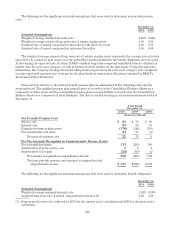
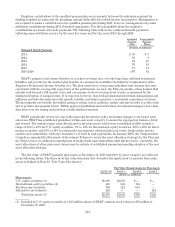
BB&T measures the fair value of each option award on the date of grant using the Black-Scholes option-
pricing model with the following weighted average assumptions used for grants awarded in 2010, 2009 and 2008,
respectively. Substantially all of BB&T’s option awards are granted in February of each year. Therefore, the
assumptions noted below are weighted accordingly.
Years Ended December 31,
2010 2009 2008
Assumptions:
Risk-free interest rate 2.0% 3.1% 3.7%
Dividend yield 5.4 6.0 4.5
Volatility factor 36.0 29.1 15.5
Expected life 7.2 yrs 7.1 yrs 6.9 yrs
Fair value of options per share $5.60 $2.59 $3.43
BB&T determines the assumptions used in the Black-Scholes option pricing model as follows: the risk-free
interest rate is based on the U.S. Treasury yield curve in effect at the time of the grant; the dividend yield is
based on the historical dividend yield of BB&T’s stock, adjusted to reflect the expected dividend yield over the
expected life of the option; the volatility factor is based on the historical volatility of BB&T’s stock, adjusted to
reflect the ways in which current information indicates that the future is reasonably expected to differ from the
past; and the weighted-average expected life is based on the historical behavior of employees related to exercises,
forfeitures and cancellations.
BB&T measures the fair value of restricted shares based on the price of BB&T’s common stock on the grant
date and the fair value of restricted share units based on the price of BB&T’s common stock on the grant date less
the present value of expected dividends that are foregone during the vesting period.
BB&T recorded $79 million, $62 million and $75 million in equity-based compensation in 2010, 2009 and 2008,
respectively. In connection with this compensation expense, BB&T recorded an income tax benefit of $30 million,
$24 million and $29 million in 2010, 2009 and 2008, respectively. The total intrinsic value of options exercised or
restricted share units vested during 2010, 2009 and 2008 was $22 million, $6 million and $20 million, respectively.
The total grant date fair value of equity-based awards that vested during 2010 was $39 million. As of
December 31, 2010, there was $104 million of unrecognized compensation costs related to BB&T’s equity-based
awards that is expected to be recognized over a weighted-average life of 3.0 years.
135