BB&T 2010 Annual Report Download - page 124
Download and view the complete annual report
Please find page 124 of the 2010 BB&T annual report below. You can navigate through the pages in the report by either clicking on the pages listed below, or by using the keyword search tool below to find specific information within the annual report.-
 1
1 -
2
-
3
-
4
-
5
-
6
-
7
-
8
-
9
-
10
-
11
-
12
-
13
-
14
-
15
-
16
-
17
-
18
-
19
-
20
-
21
-
22
-
23
-
24
-
25
-
26
-
27
-
28
-
29
-
30
-
31
-
32
-
33
-
34
-
35
-
36
-
37
-
38
-
39
-
40
-
41
-
42
-
43
-
44
-
45
-
46
-
47
-
48
-
49
-
50
-
51
-
52
-
53
-
54
-
55
-
56
-
57
-
58
-
59
-
60
-
61
-
62
-
63
-
64
-
65
-
66
-
67
-
68
-
69
-
70
-
71
-
72
-
73
-
74
-
75
-
76
-
77
-
78
-
79
-
80
-
81
-
82
-
83
-
84
-
85
-
86
-
87
-
88
-
89
-
90
-
91
-
92
-
93
-
94
-
95
-
96
-
97
-
98
-
99
-
100
-
101
-
102
-
103
-
104
-
105
-
106
-
107
-
108
-
109
-
110
-
111
-
112
-
113
-
 114
114 -
 115
115 -
 116
116 -
 117
117 -
 118
118 -
 119
119 -
 120
120 -
 121
121 -
 122
122 -
 123
123 -
 124
124 -
 125
125 -
 126
126 -
 127
127 -
 128
128 -
 129
129 -
 130
130 -
 131
131 -
 132
132 -
 133
133 -
 134
134 -
135
-
136
-
137
-
138
-
139
-
140
-
141
-
142
-
143
-
144
-
145
-
146
-
147
-
148
-
149
-
150
-
151
-
152
-
153
-
154
-
155
-
156
-
157
-
158
-
159
-
160
-
161
-
162
-
163
-
164
-
165
-
166
-
167
-
168
-
169
-
170
-
171
-
172
-
173
-
174
-
175
-
176
-
177
-
178
-
179
-
180
-
181
 |
 |

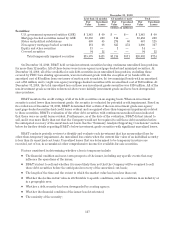
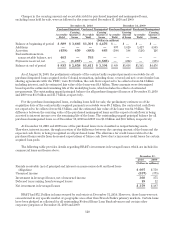
BB&T monitors the credit quality of its commercial portfolio segment using internal risk ratings. These
ratings have been correlated with bond ratings for similar instruments based on management’s judgment. BB&T
assigns an internal risk rating at loan origination and reviews the relationship again on an annual basis or at any
point management becomes aware of information affecting the borrower’s ability to fulfill their obligations. Refer
to the Allowance for Loan and Lease Losses and Reserve for Unfunded Lending Commitments section of Note 1
for additional disclosures regarding BB&T’s significant policies.
BB&T monitors the credit quality of its retail portfolio segment based primarily on delinquency status, which
is the primary factor considered in determining whether a retail loan should be classified as nonaccrual. Refer to
the Nonperforming Assets section of Note 1 for additional disclosures regarding BB&T’s significant policies.
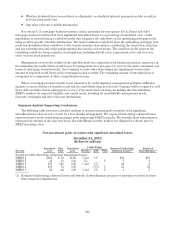
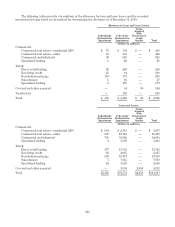
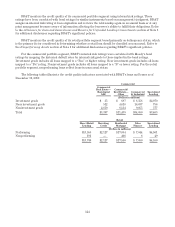
For the commercial portfolio segment, BB&T’s internal risk ratings were correlated with Moody’s bond
ratings by mapping the historical default rates by internal risk grade to those implied in the bond ratings.
Investment grade includes all loans mapped to a “Baa” or higher rating. Near investment grade includes all loans
mapped to a “Ba” rating. Noninvestment grade includes all loans mapped to a “B” or lower rating. For the retail
portfolio segment, nonperforming loans reflect loans in nonaccrual status.
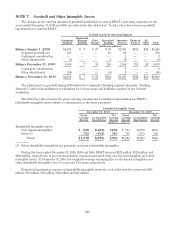
The following tables illustrate the credit quality indicators associated with BB&T’s loans and leases as of
December 31, 2010:
Commercial
Commercial
Real Estate—
Residential
ADC
Commercial
Real Estate—
Other Commercial
& Industrial Specialized
Lending
(Dollars in millions)
Investment grade $ 35 $ 687 $ 8,358 $2,070
Near investment grade 512 4,618 16,637 756
Noninvestment grade 2,850 6,134 9,055 577
Total $3,397 $11,439 $34,050 $3,403
Retail
Direct Retail
Lending Revolving
Credit Residential
Mortgage Sales
Finance Specialized
Lending
(Dollars in millions)
Performing $13,558 $2,127 $17,084 $ 7,044 $4,501
Nonperforming 191 — 466 6 49
$13,749 $2,127 $17,550 $ 7,050 $4,550
124