BB&T 2010 Annual Report Download - page 54
Download and view the complete annual report
Please find page 54 of the 2010 BB&T annual report below. You can navigate through the pages in the report by either clicking on the pages listed below, or by using the keyword search tool below to find specific information within the annual report.-
 1
1 -
2
-
3
-
4
-
5
-
6
-
7
-
8
-
9
-
10
-
11
-
12
-
13
-
14
-
15
-
16
-
17
-
18
-
19
-
20
-
21
-
22
-
23
-
24
-
25
-
26
-
27
-
28
-
29
-
30
-
31
-
32
-
33
-
34
-
35
-
36
-
37
-
38
-
39
-
40
-
41
-
42
-
43
-
 44
44 -
 45
45 -
 46
46 -
 47
47 -
 48
48 -
 49
49 -
 50
50 -
 51
51 -
 52
52 -
 53
53 -
 54
54 -
 55
55 -
 56
56 -
 57
57 -
 58
58 -
 59
59 -
 60
60 -
 61
61 -
 62
62 -
 63
63 -
 64
64 -
65
-
66
-
67
-
68
-
69
-
70
-
71
-
72
-
73
-
74
-
75
-
76
-
77
-
78
-
79
-
80
-
81
-
82
-
83
-
84
-
85
-
86
-
87
-
88
-
89
-
90
-
91
-
92
-
93
-
94
-
95
-
96
-
97
-
98
-
99
-
100
-
101
-
102
-
103
-
104
-
105
-
106
-
107
-
108
-
109
-
110
-
111
-
112
-
113
-
114
-
115
-
116
-
117
-
118
-
119
-
120
-
121
-
122
-
123
-
124
-
125
-
126
-
127
-
128
-
129
-
130
-
131
-
132
-
133
-
134
-
135
-
136
-
137
-
138
-
139
-
140
-
141
-
142
-
143
-
144
-
145
-
146
-
147
-
148
-
149
-
150
-
151
-
152
-
153
-
154
-
155
-
156
-
157
-
158
-
159
-
160
-
161
-
162
-
163
-
164
-
165
-
166
-
167
-
168
-
169
-
170
-
171
-
172
-
173
-
174
-
175
-
176
-
177
-
178
-
179
-
180
-
181
 |
 |
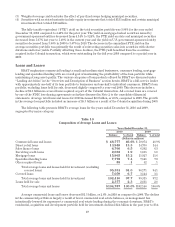
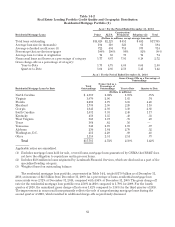
Nonperforming assets consist of foreclosed real estate, repossessions, nonaccrual loans and certain
restructured loans, which totaled $4.3 billion at December 31, 2010 (or $4.0 billion excluding covered foreclosed
property), compared to $4.3 billion (or $4.2 billion excluding covered foreclosed property) at December 31, 2009.
After peaking in the first quarter of 2010, nonperforming assets excluding covered foreclosed property declined
$423 million in the last three quarters of 2010 as BB&T continued to successfully implement its nonperforming
asset disposition strategy. As a percentage of loans and leases plus foreclosed property, nonperforming assets
were 3.94% at December 31, 2010 (or 3.88% excluding covered loans and foreclosed property) compared with
4.02% (or 4.18% excluding covered loans and foreclosed property) at December 31, 2009.
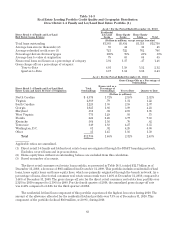
Past due loans still accruing decreased 13.7% compared to the level at year-end 2009. Loans 90 days or more
past due and still accruing interest, excluding covered loans and government guaranteed mortgage loans, totaled
$295 million at December 31, 2010, compared with $311 million at year-end 2009. Loans 30-89 days past due,
excluding covered loans and government guaranteed mortgage loans, totaled $1.4 billion at December 31, 2010,
which was also a decline compared with $1.7 billion at year-end 2009.
54