BB&T 2010 Annual Report Download - page 78
Download and view the complete annual report
Please find page 78 of the 2010 BB&T annual report below. You can navigate through the pages in the report by either clicking on the pages listed below, or by using the keyword search tool below to find specific information within the annual report.-
 1
1 -
2
-
3
-
4
-
5
-
6
-
7
-
8
-
9
-
10
-
11
-
12
-
13
-
14
-
15
-
16
-
17
-
18
-
19
-
20
-
21
-
22
-
23
-
24
-
25
-
26
-
27
-
28
-
29
-
30
-
31
-
32
-
33
-
34
-
35
-
36
-
37
-
38
-
39
-
40
-
41
-
42
-
43
-
44
-
45
-
46
-
47
-
48
-
49
-
50
-
51
-
52
-
53
-
54
-
55
-
56
-
57
-
58
-
59
-
60
-
61
-
62
-
63
-
64
-
65
-
66
-
67
-
 68
68 -
 69
69 -
 70
70 -
 71
71 -
 72
72 -
 73
73 -
 74
74 -
 75
75 -
 76
76 -
 77
77 -
 78
78 -
 79
79 -
 80
80 -
 81
81 -
 82
82 -
 83
83 -
 84
84 -
 85
85 -
 86
86 -
 87
87 -
 88
88 -
89
-
90
-
91
-
92
-
93
-
94
-
95
-
96
-
97
-
98
-
99
-
100
-
101
-
102
-
103
-
104
-
105
-
106
-
107
-
108
-
109
-
110
-
111
-
112
-
113
-
114
-
115
-
116
-
117
-
118
-
119
-
120
-
121
-
122
-
123
-
124
-
125
-
126
-
127
-
128
-
129
-
130
-
131
-
132
-
133
-
134
-
135
-
136
-
137
-
138
-
139
-
140
-
141
-
142
-
143
-
144
-
145
-
146
-
147
-
148
-
149
-
150
-
151
-
152
-
153
-
154
-
155
-
156
-
157
-
158
-
159
-
160
-
161
-
162
-
163
-
164
-
165
-
166
-
167
-
168
-
169
-
170
-
171
-
172
-
173
-
174
-
175
-
176
-
177
-
178
-
179
-
180
-
181
 |
 |

that will produce consistent net interest income during periods of changing interest rates. BB&T’s Market Risk
and Liquidity Committee monitors loan, investment and liability portfolios to ensure comprehensive management
of interest rate risk. These portfolios are analyzed for proper fixed-rate and variable-rate mixes under various
interest rate scenarios.
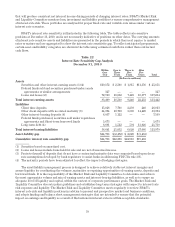
BB&T’s interest rate sensitivity is illustrated in the following table. The table reflects rate-sensitive
positions at December 31, 2010, and is not necessarily indicative of positions on other dates. The carrying amounts
of interest rate sensitive assets and liabilities are presented in the periods in which they next reprice to market
rates or mature and are aggregated to show the interest rate sensitivity gap. To reflect anticipated prepayments,
certain asset and liability categories are shown in the table using estimated cash flows rather than contractual
cash flows.
Table 22
Interest Rate Sensitivity Gap Analysis
December 31, 2010
Within
One
Year
One to
Three
Years
Three to
Five
Years
After
Five
Years Total
(Dollars in millions)
Assets
Securities and other interest-earning assets (1)(4) $10,172 $ 2,508 $ 1,815 $11,356 $ 25,851
Federal funds sold and securities purchased under resale
agreements or similar arrangements 327 — — — 327
Loans and leases (2) 72,910 16,052 7,425 10,877 107,264
Total interest-earning assets 83,409 18,560 9,240 22,233 133,442
Liabilities
Client time deposits 15,826 7,708 2,239 240 26,013
Other client deposits with no stated maturity (3) 24,394 10,700 3,880 14,420 53,394
Other interest-bearing deposits (4) 6,057 1,112 — — 7,169
Federal funds purchased, securities sold under repurchase
agreements and Short-term borrowed funds 5,673 — — — 5,673
Long-term debt (4) 6,691 1,512 501 13,026 21,730
Total interest-bearing liabilities 58,641 21,032 6,620 27,686 113,979
Asset-liability gap $24,768 $ (2,472) $ 2,620 $ (5,453)
Cumulative interest rate sensitivity gap $24,768 $22,296 $24,916 $19,463
(1) Securities based on amortized cost.
(2) Loans and leases include loans held for sale and are net of unearned income.
(3) Projected runoff of deposits that do not have a contractual maturity date was computed based upon decay
rate assumptions developed by bank regulators to assist banks in addressing FDICIA rule 305.
(4) The maturity periods have been adjusted to reflect the impact of hedging strategies.
The asset/liability management process is designed to achieve relatively stable net interest margins and
assure liquidity by coordinating the volumes, maturities or repricing opportunities of earning assets, deposits and
borrowed funds. It is the responsibility of the Market Risk and Liquidity Committee to determine and achieve
the most appropriate volume and mix of earning assets and interest-bearing liabilities, as well as to ensure an
adequate level of liquidity and capital, within the context of corporate performance goals. The Market Risk and
Liquidity Committee also sets policy guidelines and establishes long-term strategies with respect to interest rate
risk exposure and liquidity. The Market Risk and Liquidity Committee meets regularly to review BB&T’s
interest rate risk and liquidity positions in relation to present and prospective market and business conditions,
and adopts funding and balance sheet management strategies that are intended to ensure that the potential
impact on earnings and liquidity as a result of fluctuations in interest rates is within acceptable standards.
78