BB&T 2010 Annual Report Download - page 74
Download and view the complete annual report
Please find page 74 of the 2010 BB&T annual report below. You can navigate through the pages in the report by either clicking on the pages listed below, or by using the keyword search tool below to find specific information within the annual report.-
 1
1 -
2
-
3
-
4
-
5
-
6
-
7
-
8
-
9
-
10
-
11
-
12
-
13
-
14
-
15
-
16
-
17
-
18
-
19
-
20
-
21
-
22
-
23
-
24
-
25
-
26
-
27
-
28
-
29
-
30
-
31
-
32
-
33
-
34
-
35
-
36
-
37
-
38
-
39
-
40
-
41
-
42
-
43
-
44
-
45
-
46
-
47
-
48
-
49
-
50
-
51
-
52
-
53
-
54
-
55
-
56
-
57
-
58
-
59
-
60
-
61
-
62
-
63
-
 64
64 -
 65
65 -
 66
66 -
 67
67 -
 68
68 -
 69
69 -
 70
70 -
 71
71 -
 72
72 -
 73
73 -
 74
74 -
 75
75 -
 76
76 -
 77
77 -
 78
78 -
 79
79 -
 80
80 -
 81
81 -
 82
82 -
 83
83 -
 84
84 -
85
-
86
-
87
-
88
-
89
-
90
-
91
-
92
-
93
-
94
-
95
-
96
-
97
-
98
-
99
-
100
-
101
-
102
-
103
-
104
-
105
-
106
-
107
-
108
-
109
-
110
-
111
-
112
-
113
-
114
-
115
-
116
-
117
-
118
-
119
-
120
-
121
-
122
-
123
-
124
-
125
-
126
-
127
-
128
-
129
-
130
-
131
-
132
-
133
-
134
-
135
-
136
-
137
-
138
-
139
-
140
-
141
-
142
-
143
-
144
-
145
-
146
-
147
-
148
-
149
-
150
-
151
-
152
-
153
-
154
-
155
-
156
-
157
-
158
-
159
-
160
-
161
-
162
-
163
-
164
-
165
-
166
-
167
-
168
-
169
-
170
-
171
-
172
-
173
-
174
-
175
-
176
-
177
-
178
-
179
-
180
-
181
 |
 |

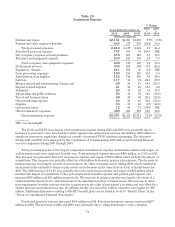
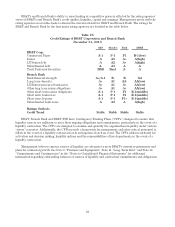
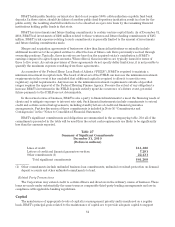
Table 20
Noninterest Expense
Years Ended December 31,
% Change
2010
v.
2009
2009
v.
20082010 2009 2008
(Dollars in millions)
Salaries and wages $2,153 $2,000 $1,863 7.7% 7.4%
Pension and other employee benefits 463 517 338 (10.4) 53.0
Total personnel expenses 2,616 2,517 2,201 3.9 14.4
Foreclosed property expense 747 356 79 109.8 NM
Net occupancy expense on bank premises 378 366 310 3.3 18.1
Furniture and equipment expense 230 213 199 8.0 7.0
Total occupancy and equipment expenses 608 579 509 5.0 13.8
Professional services 334 262 204 27.5 28.4
Regulatory charges 211 230 30 (8.3) NM
Loan processing expenses 180 135 125 33.3 8.0
Amortization of intangibles 122 114 100 7.0 14.0
Software 117 94 74 24.5 27.0
Merger-related and restructuring charges, net 69 38 15 81.6 153.3
Deposit related expense 61 53 49 15.1 8.2
Telephone 50 47 42 6.4 11.9
Advertising and public relations 50 31 50 61.3 (38.0)
Travel and transportation 48 39 52 23.1 (25.0)
Other marketing expense 43 33 46 30.3 (28.3)
Supplies 33 35 40 (5.7) (12.5)
Operational losses 12 60 17 (80.0) NM
Other noninterest expenses 369 308 278 19.8 10.8
Total noninterest expense $5,670 $4,931 $3,911 15.0% 26.1%
NM—not meaningful
The 15.0% and 26.1% increases in total noninterest expense during 2010 and 2009 were primarily due to
increases in personnel costs, foreclosed property expense and professional services. In addition, 2009 reflects a
significant increase in regulatory charges as a result of increased FDIC insurance premiums. The increases
during 2010 and 2009 were impacted by the acquisitions of Colonial during 2009 and several nonbank financial
services companies during 2008 through 2009.
Total personnel expense is the largest component of noninterest expense and includes salaries and wages, as
well as pension and other employee benefit costs. Total personnel expense increased $99 million, or 3.9%, in 2010.
This increase was primarily driven by increases in salaries and wages of $153 million which includes the impact of
acquisitions. This increase was partially offset by a $54 million decrease in pension plan expense. The decrease in
pension expense was largely a result of an increase in the value of pension assets during 2009, which resulted in
an increase in the estimated return on plan assets and a decrease in the amortization of net actuarial losses for
2010. The 2009 increase of 14.4% was partially driven by increases in salaries and wages of $137 million which
included the impact of acquisitions. Other post-employment benefits expense and pension plan expense also
increased $67 million and $66 million, respectively. The increase in pension expense was largely the result of a
reduction in the discount rate, and an increase in the amortization of net actuarial losses. The increase in other
post employment benefits expense was due to increases in the value of participant’s accounts and was offset by a
similar increase in noninterest income. In addition, health care and other welfare expenses were higher by $36
million. Additional disclosures relating to BB&T’s benefit plans can be found in Note 15 “Benefit Plans” in the
“Notes to Consolidated Financial Statements.”
Foreclosed property expense increased $391 million in 2010. Foreclosed property expense increased $277
million in 2009. The increases in 2010 and 2009 were primarily due to rising maintenance costs, valuation
74