BB&T 2010 Annual Report Download - page 65
Download and view the complete annual report
Please find page 65 of the 2010 BB&T annual report below. You can navigate through the pages in the report by either clicking on the pages listed below, or by using the keyword search tool below to find specific information within the annual report.-
 1
1 -
2
-
3
-
4
-
5
-
6
-
7
-
8
-
9
-
10
-
11
-
12
-
13
-
14
-
15
-
16
-
17
-
18
-
19
-
20
-
21
-
22
-
23
-
24
-
25
-
26
-
27
-
28
-
29
-
30
-
31
-
32
-
33
-
34
-
35
-
36
-
37
-
38
-
39
-
40
-
41
-
42
-
43
-
44
-
45
-
46
-
47
-
48
-
49
-
50
-
51
-
52
-
53
-
54
-
 55
55 -
 56
56 -
 57
57 -
 58
58 -
 59
59 -
 60
60 -
 61
61 -
 62
62 -
 63
63 -
 64
64 -
 65
65 -
 66
66 -
 67
67 -
 68
68 -
 69
69 -
 70
70 -
 71
71 -
 72
72 -
 73
73 -
 74
74 -
 75
75 -
76
-
77
-
78
-
79
-
80
-
81
-
82
-
83
-
84
-
85
-
86
-
87
-
88
-
89
-
90
-
91
-
92
-
93
-
94
-
95
-
96
-
97
-
98
-
99
-
100
-
101
-
102
-
103
-
104
-
105
-
106
-
107
-
108
-
109
-
110
-
111
-
112
-
113
-
114
-
115
-
116
-
117
-
118
-
119
-
120
-
121
-
122
-
123
-
124
-
125
-
126
-
127
-
128
-
129
-
130
-
131
-
132
-
133
-
134
-
135
-
136
-
137
-
138
-
139
-
140
-
141
-
142
-
143
-
144
-
145
-
146
-
147
-
148
-
149
-
150
-
151
-
152
-
153
-
154
-
155
-
156
-
157
-
158
-
159
-
160
-
161
-
162
-
163
-
164
-
165
-
166
-
167
-
168
-
169
-
170
-
171
-
172
-
173
-
174
-
175
-
176
-
177
-
178
-
179
-
180
-
181
 |
 |

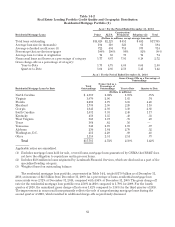
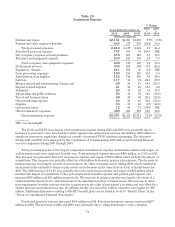
securities sold under repurchase agreements, which was 21.0% of short-term borrowings at year-end 2010.
Master notes, which are short-term borrowings issued to BB&T’s clients, represented 14.2% of total short-term
borrowings at December 31, 2010. Unsecured bank notes, bank obligations collateralized by municipal securities,
U.S. Treasury tax and loan deposit notes and borrowings under the treasury auction facility are also used to meet
short-term funding needs and represented the remaining 64.4% of these types of funding sources as of
December 31, 2010. Short-term borrowings at the end of 2010 were $5.7 billion, a decrease of $2.4 billion, or 30.0%
compared to year-end 2009. Average short-term borrowings totaled $9.0 billion during 2010 compared to $12.5
billion last year, a decrease of 27.8%. The decline in the balances during 2010 primarily reflect the balance sheet
deleveraging strategy that was executed during the second quarter of 2010 and strong growth in client deposits
which has reduced the Corporation’s reliance on short term funding. The rates paid on average short-term
borrowings declined from .50% in 2009 to .28% during 2010. At December 31, 2010, the targeted Federal funds
rate was a range of zero percent to .25%.
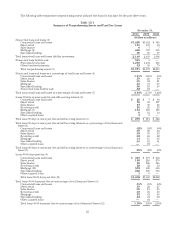
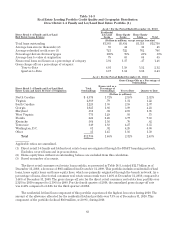
The following table summarizes certain pertinent information for the past three years with respect to
BB&T’s short-term borrowings:
Table 16
Federal Funds Purchased, Securities Sold Under
Agreements to Repurchase and Short-Term Borrowed Funds
As of / For the Year Ended
December 31,
2010 2009 2008
(Dollars in millions)
Securities Sold Under Agreements to Repurchase
Maximum outstanding at any month-end during the year $ 2,299 $ 2,635 $ 2,929
Balance outstanding at end of year 1,189 2,197 2,929
Average outstanding during the year 1,620 2,259 2,314
Average interest rate during the year .85% .96% 2.40%
Average interest rate at end of year .96 .69 1.41
Federal Funds Purchased and Short-term Borrowed Funds
Maximum outstanding at any month-end during the year $10,486 $17,436 $13,346
Balance outstanding at end of year 4,484 5,909 7,859
Average outstanding during the year 7,402 10,232 8,266
Average interest rate during the year .10% .35% 2.17%
Average interest rate at end of year .32 .21 .67
BB&T also uses long-term debt to provide both funding and, to a lesser extent, regulatory capital. Long-term
debt was 13.6% of total funding on average during 2010 and 12.3% in 2009. See Note 11 “Long-Term Debt” in the
“Notes to Consolidated Financial Statements” herein for further disclosure. Long-term debt at December 31,
2010, totaled $21.7 billion, an increase of 1.7% from year-end 2009. The increase in long-term debt was primarily
due to the issuance of $500 million of senior notes, with an interest rate of 3.95% due April 2016. For the year
ended December 31, 2010, average long-term debt increased $2.6 billion, or 13.5%, compared to the average for
2009. The increase in average long-term debt reflects the current year issuance of $500 million and various
issuances of long-term debt completed during 2009. BB&T’s long-term debt consists primarily of FHLB
advances, which composed 47.1% of total outstanding long-term debt at December 31, 2010; senior notes of BB&T
Corporation, which composed 15.2% of the year-end balance; subordinated notes of BB&T Corporation, which
composed 13.6% of the year-end balance; and junior subordinated debt to unconsolidated trusts issued by the
Corporation, which composed 15.0% of total outstanding long-term debt at December 31, 2010. The remaining
long-term debt primarily consists of both unsecured senior and subordinated borrowings by Branch Bank. FHLB
advances are cost-effective long-term funding sources that provide BB&T with the flexibility to structure the
debt in a manner that aids in the management of interest rate risk and liquidity. The average rate paid on long-
term debt increased from 3.73% during 2009 to 3.96% during 2010.
Liquidity needs are a primary consideration in evaluating funding sources. BB&T’s strategy is to maintain
funding flexibility in order that the Corporation may react rapidly to opportunities that may become available in
65