BB&T 2010 Annual Report Download - page 121
Download and view the complete annual report
Please find page 121 of the 2010 BB&T annual report below. You can navigate through the pages in the report by either clicking on the pages listed below, or by using the keyword search tool below to find specific information within the annual report.-
 1
1 -
2
-
3
-
4
-
5
-
6
-
7
-
8
-
9
-
10
-
11
-
12
-
13
-
14
-
15
-
16
-
17
-
18
-
19
-
20
-
21
-
22
-
23
-
24
-
25
-
26
-
27
-
28
-
29
-
30
-
31
-
32
-
33
-
34
-
35
-
36
-
37
-
38
-
39
-
40
-
41
-
42
-
43
-
44
-
45
-
46
-
47
-
48
-
49
-
50
-
51
-
52
-
53
-
54
-
55
-
56
-
57
-
58
-
59
-
60
-
61
-
62
-
63
-
64
-
65
-
66
-
67
-
68
-
69
-
70
-
71
-
72
-
73
-
74
-
75
-
76
-
77
-
78
-
79
-
80
-
81
-
82
-
83
-
84
-
85
-
86
-
87
-
88
-
89
-
90
-
91
-
92
-
93
-
94
-
95
-
96
-
97
-
98
-
99
-
100
-
101
-
102
-
103
-
104
-
105
-
106
-
107
-
108
-
109
-
110
-
 111
111 -
 112
112 -
 113
113 -
 114
114 -
 115
115 -
 116
116 -
 117
117 -
 118
118 -
 119
119 -
 120
120 -
 121
121 -
 122
122 -
 123
123 -
 124
124 -
 125
125 -
 126
126 -
 127
127 -
 128
128 -
 129
129 -
 130
130 -
 131
131 -
132
-
133
-
134
-
135
-
136
-
137
-
138
-
139
-
140
-
141
-
142
-
143
-
144
-
145
-
146
-
147
-
148
-
149
-
150
-
151
-
152
-
153
-
154
-
155
-
156
-
157
-
158
-
159
-
160
-
161
-
162
-
163
-
164
-
165
-
166
-
167
-
168
-
169
-
170
-
171
-
172
-
173
-
174
-
175
-
176
-
177
-
178
-
179
-
180
-
181
 |
 |

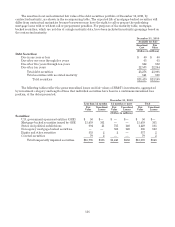
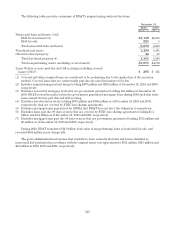
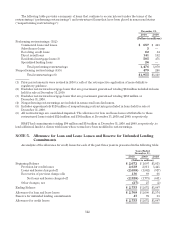
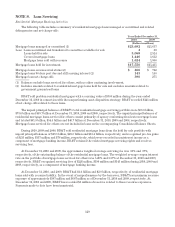
The following table provides a summary of BB&T’s nonperforming and past due loans:
December 31,
2010 2009
(Dollars in millions)
Nonaccrual loans and leases: (1)(2)
Held for investment (3) $2,149 $2,658
Held for sale 521 5
Total nonaccrual loans and leases 2,670 2,663
Foreclosed real estate 1,259 1,451
Other foreclosed property 42 58
Total foreclosed property (4) 1,301 1,509
Total nonperforming assets (excluding covered assets) $3,971 $4,172
Loans 90 days or more past due and still accruing (excluding covered
loans) (5)(6)(7) $ 295 $ 311
(1) Covered and other acquired loans are considered to be performing due to the application of the accretion
method. Covered loans that are contractually past due are noted in footnote (6) below.
(2) Includes nonperforming restructurings totaling $479 million and $248 million at December 31, 2010 and 2009,
respectively.
(3) Excludes nonaccrual mortgage loans that are government guaranteed totaling $55 million at December 31,
2009. BB&T revised its policy related to government guaranteed mortgage loans during 2010 such that these
loans remain 90 days past due and still accruing.
(4) Excludes foreclosed real estate totaling $313 million and $160 million as of December 31, 2010 and 2009,
respectively, that are covered by FDIC loss sharing agreements.
(5) Excludes mortgage loans guaranteed by GNMA that BB&T does not have the obligation to repurchase.
(6) Excludes loans past due 90 days or more that are covered by FDIC loss sharing agreements totaling $1.1
billion and $1.4 billion as of December 31, 2010 and 2009, respectively.
(7) Excludes mortgage loans past due 90 days or more that are government guaranteed totaling $153 million and
$8 million as of December 31, 2010 and 2009, respectively.
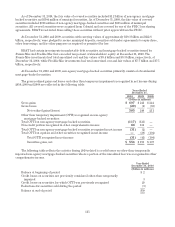
During 2010, BB&T transferred $1.9 billion book value of nonperforming loans to loans held for sale, and
recorded $605 million in net charge-offs.
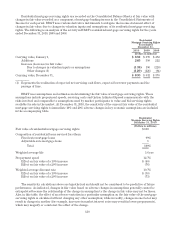
The gross additional interest income that would have been earned if the loans and leases classified as
nonaccrual had performed in accordance with the original terms was approximately $131 million, $115 million and
$69 million in 2010, 2009 and 2008, respectively.
121