BB&T 2010 Annual Report Download - page 123
Download and view the complete annual report
Please find page 123 of the 2010 BB&T annual report below. You can navigate through the pages in the report by either clicking on the pages listed below, or by using the keyword search tool below to find specific information within the annual report.-
 1
1 -
2
-
3
-
4
-
5
-
6
-
7
-
8
-
9
-
10
-
11
-
12
-
13
-
14
-
15
-
16
-
17
-
18
-
19
-
20
-
21
-
22
-
23
-
24
-
25
-
26
-
27
-
28
-
29
-
30
-
31
-
32
-
33
-
34
-
35
-
36
-
37
-
38
-
39
-
40
-
41
-
42
-
43
-
44
-
45
-
46
-
47
-
48
-
49
-
50
-
51
-
52
-
53
-
54
-
55
-
56
-
57
-
58
-
59
-
60
-
61
-
62
-
63
-
64
-
65
-
66
-
67
-
68
-
69
-
70
-
71
-
72
-
73
-
74
-
75
-
76
-
77
-
78
-
79
-
80
-
81
-
82
-
83
-
84
-
85
-
86
-
87
-
88
-
89
-
90
-
91
-
92
-
93
-
94
-
95
-
96
-
97
-
98
-
99
-
100
-
101
-
102
-
103
-
104
-
105
-
106
-
107
-
108
-
109
-
110
-
111
-
112
-
 113
113 -
 114
114 -
 115
115 -
 116
116 -
 117
117 -
 118
118 -
 119
119 -
 120
120 -
 121
121 -
 122
122 -
 123
123 -
 124
124 -
 125
125 -
 126
126 -
 127
127 -
 128
128 -
 129
129 -
 130
130 -
 131
131 -
 132
132 -
 133
133 -
134
-
135
-
136
-
137
-
138
-
139
-
140
-
141
-
142
-
143
-
144
-
145
-
146
-
147
-
148
-
149
-
150
-
151
-
152
-
153
-
154
-
155
-
156
-
157
-
158
-
159
-
160
-
161
-
162
-
163
-
164
-
165
-
166
-
167
-
168
-
169
-
170
-
171
-
172
-
173
-
174
-
175
-
176
-
177
-
178
-
179
-
180
-
181
 |
 |

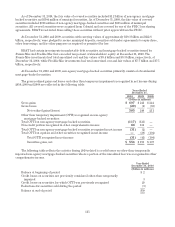
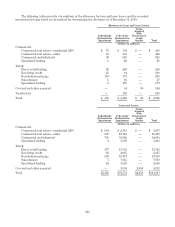
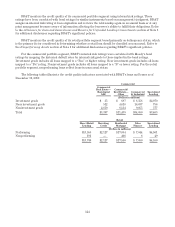
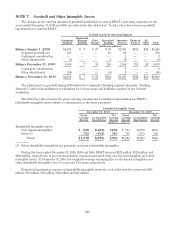
The following tables provide a breakdown of the allowance for loan and lease losses and the recorded
investment in loans based on the method for determining the allowance as of December 31, 2010:
Allowance for Loan and Lease Losses
Individually
Evaluated for
Impairment
Collectively
Evaluated for
Impairment
Loans
Acquired
With
Deteriorated
Credit
Quality Total
(Dollars in millions)
Commercial:
Commercial real estate—residential ADC $ 75 $ 394 $ — $ 469
Commercial real estate—other 63 383 — 446
Commercial and industrial 96 525 — 621
Specialized lending 1 20 — 21
Retail:
Direct retail lending 26 220 — 246
Revolving credit 25 84 — 109
Residential mortgage 167 131 — 298
Sales finance 1 46 — 47
Specialized lending 2 175 — 177
Covered and other acquired — 54 90 144
Unallocated — 130 — 130
Total $ 456 $ 2,162 $ 90 $ 2,708
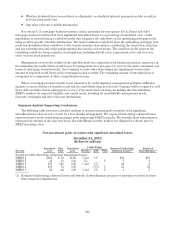
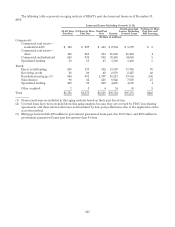
Loans and Leases
Individually
Evaluated for
Impairment
Collectively
Evaluated for
Impairment
Loans
Acquired
With
Deteriorated
Credit
Quality Total
(Dollars in millions)
Commercial:
Commercial real estate—residential ADC $ 684 $ 2,713 $ — $ 3,397
Commercial real estate—other 691 10,748 — 11,439
Commercial and industrial 708 33,342 — 34,050
Specialized lending 4 3,399 — 3,403
Retail:
Direct retail lending 177 13,572 — 13,749
Revolving credit 62 2,065 — 2,127
Residential mortgage 803 16,747 — 17,550
Sales finance 5 7,045 — 7,050
Specialized lending 24 4,526 — 4,550
Covered and other acquired — 3,394 2,858 6,252
Total $3,158 $97,551 $2,858 $103,567
123