BB&T 2010 Annual Report Download - page 158
Download and view the complete annual report
Please find page 158 of the 2010 BB&T annual report below. You can navigate through the pages in the report by either clicking on the pages listed below, or by using the keyword search tool below to find specific information within the annual report.-
 1
1 -
2
-
3
-
4
-
5
-
6
-
7
-
8
-
9
-
10
-
11
-
12
-
13
-
14
-
15
-
16
-
17
-
18
-
19
-
20
-
21
-
22
-
23
-
24
-
25
-
26
-
27
-
28
-
29
-
30
-
31
-
32
-
33
-
34
-
35
-
36
-
37
-
38
-
39
-
40
-
41
-
42
-
43
-
44
-
45
-
46
-
47
-
48
-
49
-
50
-
51
-
52
-
53
-
54
-
55
-
56
-
57
-
58
-
59
-
60
-
61
-
62
-
63
-
64
-
65
-
66
-
67
-
68
-
69
-
70
-
71
-
72
-
73
-
74
-
75
-
76
-
77
-
78
-
79
-
80
-
81
-
82
-
83
-
84
-
85
-
86
-
87
-
88
-
89
-
90
-
91
-
92
-
93
-
94
-
95
-
96
-
97
-
98
-
99
-
100
-
101
-
102
-
103
-
104
-
105
-
106
-
107
-
108
-
109
-
110
-
111
-
112
-
113
-
114
-
115
-
116
-
117
-
118
-
119
-
120
-
121
-
122
-
123
-
124
-
125
-
126
-
127
-
128
-
129
-
130
-
131
-
132
-
133
-
134
-
135
-
136
-
137
-
138
-
139
-
140
-
141
-
142
-
143
-
144
-
145
-
146
-
147
-
 148
148 -
 149
149 -
 150
150 -
 151
151 -
 152
152 -
 153
153 -
 154
154 -
 155
155 -
 156
156 -
 157
157 -
 158
158 -
 159
159 -
 160
160 -
 161
161 -
 162
162 -
 163
163 -
 164
164 -
 165
165 -
 166
166 -
 167
167 -
 168
168 -
169
-
170
-
171
-
172
-
173
-
174
-
175
-
176
-
177
-
178
-
179
-
180
-
181
 |
 |

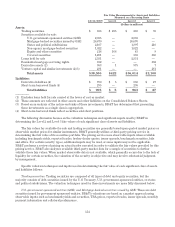
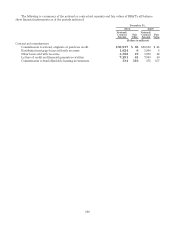
The following table details the fair value and unpaid principal balance of loans held for sale at December 31,
2010 and 2009 that were elected to be carried at fair value.
December 31,
2010 2009
Fair
Value
Aggregate
Unpaid
Principal
Balance
Fair Value Less
Aggregate
Unpaid
Principal
Balance Fair
Value
Aggregate
Unpaid
Principal
Balance
Fair Value Less
Aggregate
Unpaid
Principal
Balance
(Dollars in millions)
Loans held for sale reported at fair value
Total (1)(2) $3,176 $3,192 $(16) $2,551 $2,544 $ 7
Nonaccrual loans —— — 5 6 (1)
Loans 90 days or more past due and
still accruing interest 11— 22 —
(1) The change in fair value is reflected in mortgage banking income.
(2) Excludes loans held for sale carried at the lower of cost or market.
BB&T may be required, from time to time, to measure certain other financial assets at fair value on a
nonrecurring basis. Assets measured at fair value on a nonrecurring basis for the years ended December 31, 2010
and 2009 that were still held on the balance sheet at December 31, 2010 and 2009 totaled $2.0 billion and $2.4
billion, respectively. The December 31, 2010 amount consists of $705 million of impaired loans, excluding covered
loans, and $1.3 billion of foreclosed real estate, excluding covered foreclosed real estate, that were classified as
Level 3 assets. The December 31, 2009 amount consists of $941 million of impaired loans, excluding covered loans,
and $1.5 billion of foreclosed real estate, excluding covered foreclosed real estate, that were classified as Level 3
assets. During the years ended December 31, 2010 and 2009, BB&T recorded $602 million and $436 million,
respectively, in losses related to write-downs of impaired loans and $496 million and $224 million, respectively, in
losses related to write-downs of foreclosed real estate. These write-downs are generally based on the appraised
value of the underlying collateral.
During 2010, BB&T transferred certain problem held for investment loans to loans held for sale. These loans
were adjusted to the lower of cost or market on the date of transfer. As of December 31, 2010, approximately $521
million of loans held for sale are being valued on BB&T’s consolidated balance sheet at the lower of cost or
market. Please refer to Note 4 for additional information about the value of the loans transferred and the amount
of write-offs recorded.
Additionally, accounting standards require the disclosure of the estimated fair value of financial instruments
that are not recorded at fair value. A financial instrument is defined as cash, evidence of an ownership interest in
an entity or a contract that creates a contractual obligation or right to deliver or receive cash or another financial
instrument from a second entity. For the financial instruments that BB&T does not record at fair value, estimates
of fair value are made at a point in time, based on relevant market data and information about the financial
instrument. Fair values are calculated based on the value of one trading unit without regard to any premium or
discount that may result from concentrations of ownership of a financial instrument, possible tax ramifications,
estimated transaction costs that may result from bulk sales or the relationship between various financial
instruments. No readily available market exists for a significant portion of BB&T’s financial instruments. Fair
value estimates for these instruments are based on current economic conditions, currency and interest rate risk
characteristics, loss experience and other factors. Many of these estimates involve uncertainties and matters of
significant judgment and cannot be determined with precision. Therefore, the calculated fair value estimates in
many instances cannot be substantiated by comparison to independent markets and, in many cases, may not be
realizable in a current sale of the instrument. In addition, changes in assumptions could significantly affect these
fair value estimates. The following methods and assumptions were used by BB&T in estimating the fair value of
these financial instruments.
Cash and cash equivalents and segregated cash due from banks: For these short-term instruments, the
carrying amounts are a reasonable estimate of fair values.
158