BB&T 2010 Annual Report Download - page 70
Download and view the complete annual report
Please find page 70 of the 2010 BB&T annual report below. You can navigate through the pages in the report by either clicking on the pages listed below, or by using the keyword search tool below to find specific information within the annual report.-
 1
1 -
2
-
3
-
4
-
5
-
6
-
7
-
8
-
9
-
10
-
11
-
12
-
13
-
14
-
15
-
16
-
17
-
18
-
19
-
20
-
21
-
22
-
23
-
24
-
25
-
26
-
27
-
28
-
29
-
30
-
31
-
32
-
33
-
34
-
35
-
36
-
37
-
38
-
39
-
40
-
41
-
42
-
43
-
44
-
45
-
46
-
47
-
48
-
49
-
50
-
51
-
52
-
53
-
54
-
55
-
56
-
57
-
58
-
59
-
 60
60 -
 61
61 -
 62
62 -
 63
63 -
 64
64 -
 65
65 -
 66
66 -
 67
67 -
 68
68 -
 69
69 -
 70
70 -
 71
71 -
 72
72 -
 73
73 -
 74
74 -
 75
75 -
 76
76 -
 77
77 -
 78
78 -
 79
79 -
 80
80 -
81
-
82
-
83
-
84
-
85
-
86
-
87
-
88
-
89
-
90
-
91
-
92
-
93
-
94
-
95
-
96
-
97
-
98
-
99
-
100
-
101
-
102
-
103
-
104
-
105
-
106
-
107
-
108
-
109
-
110
-
111
-
112
-
113
-
114
-
115
-
116
-
117
-
118
-
119
-
120
-
121
-
122
-
123
-
124
-
125
-
126
-
127
-
128
-
129
-
130
-
131
-
132
-
133
-
134
-
135
-
136
-
137
-
138
-
139
-
140
-
141
-
142
-
143
-
144
-
145
-
146
-
147
-
148
-
149
-
150
-
151
-
152
-
153
-
154
-
155
-
156
-
157
-
158
-
159
-
160
-
161
-
162
-
163
-
164
-
165
-
166
-
167
-
168
-
169
-
170
-
171
-
172
-
173
-
174
-
175
-
176
-
177
-
178
-
179
-
180
-
181
 |
 |

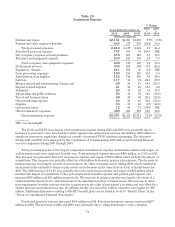
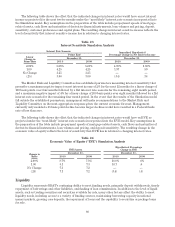
The following table provides a breakdown of BB&T’s noninterest income:
Table 18
Noninterest Income
Years Ended December 31,
% Change
2010
v.
2009
2009
v.
20082010 2009 2008
(Dollars in millions)
Insurance income $1,041 $1,047 $ 928 (.6)% 12.8%
Service charges on deposits 618 690 673 (10.4) 2.5
Mortgage banking income 521 658 275 (20.8) 139.3
Investment banking and brokerage fees and commissions 352 346 354 1.7 (2.3)
Other nondeposit fees and commissions 270 229 189 17.9 21.2
Checkcard fees 274 227 201 20.7 12.9
Bankcard fees and merchant discounts 177 156 151 13.5 3.3
Trust and investment advisory revenues 159 139 147 14.4 (5.4)
Income from bank-owned life insurance 123 97 84 26.8 15.5
FDIC loss share income, net (116) 14 — NM 100.0
Securities gains, net 554 199 107 178.4 86.0
Other income, net (16) 132 88 (112.1) 50.0
Total noninterest income $3,957 $3,934 $3,197 .6% 23.1%
NM—not meaningful
Overall noninterest income was up slightly in 2010 compared to 2009. The growth in 2010 primarily was a
result of an increase in securities gains offset by lower revenues from BB&T’s mortgage banking operations,
lower noninterest income from the FDIC loss share receivable, reduced service charges on deposit accounts and
lower revenues from other noninterest income sources. During 2009, noninterest income grew 23.1% as a result of
increased revenues from almost all of BB&T’s fee-based businesses, with the exception of small declines in
investment banking and brokerage fees and commissions and trust and investment advisory revenues. The major
categories of noninterest income and fluctuations in these amounts are discussed in the following paragraphs.
These fluctuations reflect the impact of acquisitions.
Income from BB&T’s insurance agency/brokerage operations was the largest source of noninterest income.
Insurance income was down slightly in 2010. Insurance commissions declined $29 million during 2010 reflecting
continued softness in the industry’s pricing for premiums, which was partially offset by an increase of $23 million
in insurance income from underwriting activities. The decline in insurance commissions was primarily related to
property and casualty insurance. Internal growth, combined with the expansion of BB&T’s insurance agency
network through acquisitions resulted in growth of 12.8% in 2009. The increase in commission income during 2009
was primarily related to commissions for property and casualty insurance, which increased $77 million primarily
due to acquisitions. In addition, employee benefit commissions and other insurance fees increased $14 million and
$11 million, respectively.
Service charges on deposit accounts represent BB&T’s second largest category of noninterest revenue.
Service charge revenue declined $72 million, or 10.4% during 2010. Service charge revenue increased $17 million,
or 2.5%, during 2009. The decrease in 2010 was largely a result of a decline in overdraft fees as a result of recent
changes to BB&T’s overdraft policies during 2010 that were partially in response to new regulation. The 2009
increase was primarily a result of the acquisition of Colonial and growth in transaction accounts.
Income from mortgage banking activities includes gains and losses from the sale of mortgage loans, revenue
from servicing mortgage loans, valuation adjustments for mortgage servicing rights, mortgage servicing rights-
related derivative gains/losses and the amortization or realization of expected mortgage servicing rights cash
flows.
70