BB&T 2010 Annual Report Download - page 58
Download and view the complete annual report
Please find page 58 of the 2010 BB&T annual report below. You can navigate through the pages in the report by either clicking on the pages listed below, or by using the keyword search tool below to find specific information within the annual report.-
 1
1 -
2
-
3
-
4
-
5
-
6
-
7
-
8
-
9
-
10
-
11
-
12
-
13
-
14
-
15
-
16
-
17
-
18
-
19
-
20
-
21
-
22
-
23
-
24
-
25
-
26
-
27
-
28
-
29
-
30
-
31
-
32
-
33
-
34
-
35
-
36
-
37
-
38
-
39
-
40
-
41
-
42
-
43
-
44
-
45
-
46
-
47
-
 48
48 -
 49
49 -
 50
50 -
 51
51 -
 52
52 -
 53
53 -
 54
54 -
 55
55 -
 56
56 -
 57
57 -
 58
58 -
 59
59 -
 60
60 -
 61
61 -
 62
62 -
 63
63 -
 64
64 -
 65
65 -
 66
66 -
 67
67 -
 68
68 -
69
-
70
-
71
-
72
-
73
-
74
-
75
-
76
-
77
-
78
-
79
-
80
-
81
-
82
-
83
-
84
-
85
-
86
-
87
-
88
-
89
-
90
-
91
-
92
-
93
-
94
-
95
-
96
-
97
-
98
-
99
-
100
-
101
-
102
-
103
-
104
-
105
-
106
-
107
-
108
-
109
-
110
-
111
-
112
-
113
-
114
-
115
-
116
-
117
-
118
-
119
-
120
-
121
-
122
-
123
-
124
-
125
-
126
-
127
-
128
-
129
-
130
-
131
-
132
-
133
-
134
-
135
-
136
-
137
-
138
-
139
-
140
-
141
-
142
-
143
-
144
-
145
-
146
-
147
-
148
-
149
-
150
-
151
-
152
-
153
-
154
-
155
-
156
-
157
-
158
-
159
-
160
-
161
-
162
-
163
-
164
-
165
-
166
-
167
-
168
-
169
-
170
-
171
-
172
-
173
-
174
-
175
-
176
-
177
-
178
-
179
-
180
-
181
 |
 |

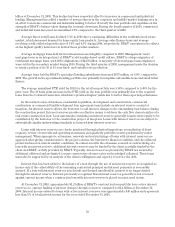
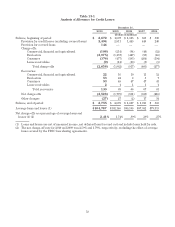
Table 13-1
Analysis of Allowance for Credit Losses
December 31,
2010 2009 2008 2007 2006
(Dollars in millions)
Balance, beginning of period $ 2,672 $ 1,607 $ 1,015 $ 888 $ 830
Provision for credit losses (excluding covered loans) 2,494 2,811 1,445 448 240
Provision for covered loans 144 ————
Charge-offs:
Commercial, financial and agricultural (198) (214) (94) (40) (32)
Real estate (2,075) (1,157) (427) (93) (46)
Consumer (376) (477) (383) (264) (194)
Lease receivables (9) (14) (13) (8) (5)
Total charge-offs (2,658) (1,862) (917) (405) (277)
Recoveries:
Commercial, financial and agricultural 22 16 10 11 12
Real estate 53 24887
Consumer 53 48 47 47 41
Lease receivables 21111
Total recoveries 130 89 66 67 61
Net charge-offs (2,528) (1,773) (851) (338) (216)
Other changes (27) 27 (2) 17 34
Balance, end of period $ 2,755 $ 2,672 $ 1,607 $ 1,015 $ 888
Average loans and leases (1) $104,787 $102,146 $95,195 $87,952 $79,313
Net charge-offs as a percentage of average loans and
leases (1) (2) 2.41% 1.74% .89% .38% .27%
(1) Loans and leases are net of unearned income, net deferred loan fees and cost and include loans held for sale.
(2) The net charge-off rate for 2010 and 2009 was 2.59% and 1.79%, respectively, excluding the effect of average
loans covered by the FDIC loss sharing agreements.
58