BB&T 2010 Annual Report Download - page 68
Download and view the complete annual report
Please find page 68 of the 2010 BB&T annual report below. You can navigate through the pages in the report by either clicking on the pages listed below, or by using the keyword search tool below to find specific information within the annual report.-
 1
1 -
2
-
3
-
4
-
5
-
6
-
7
-
8
-
9
-
10
-
11
-
12
-
13
-
14
-
15
-
16
-
17
-
18
-
19
-
20
-
21
-
22
-
23
-
24
-
25
-
26
-
27
-
28
-
29
-
30
-
31
-
32
-
33
-
34
-
35
-
36
-
37
-
38
-
39
-
40
-
41
-
42
-
43
-
44
-
45
-
46
-
47
-
48
-
49
-
50
-
51
-
52
-
53
-
54
-
55
-
56
-
57
-
 58
58 -
 59
59 -
 60
60 -
 61
61 -
 62
62 -
 63
63 -
 64
64 -
 65
65 -
 66
66 -
 67
67 -
 68
68 -
 69
69 -
 70
70 -
 71
71 -
 72
72 -
 73
73 -
 74
74 -
 75
75 -
 76
76 -
 77
77 -
 78
78 -
79
-
80
-
81
-
82
-
83
-
84
-
85
-
86
-
87
-
88
-
89
-
90
-
91
-
92
-
93
-
94
-
95
-
96
-
97
-
98
-
99
-
100
-
101
-
102
-
103
-
104
-
105
-
106
-
107
-
108
-
109
-
110
-
111
-
112
-
113
-
114
-
115
-
116
-
117
-
118
-
119
-
120
-
121
-
122
-
123
-
124
-
125
-
126
-
127
-
128
-
129
-
130
-
131
-
132
-
133
-
134
-
135
-
136
-
137
-
138
-
139
-
140
-
141
-
142
-
143
-
144
-
145
-
146
-
147
-
148
-
149
-
150
-
151
-
152
-
153
-
154
-
155
-
156
-
157
-
158
-
159
-
160
-
161
-
162
-
163
-
164
-
165
-
166
-
167
-
168
-
169
-
170
-
171
-
172
-
173
-
174
-
175
-
176
-
177
-
178
-
179
-
180
-
181
 |
 |

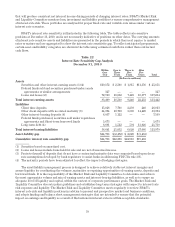
Table 17
FTE Net Interest Income and Rate / Volume Analysis
Years Ended December 31, 2010, 2009 and 2008
2010 vs. 2009 2009 vs. 2008
Average Balances Yield / Rate Income / Expense Increase
(Decrease)
Change due to Increase
(Decrease)
Change due to
2010 2009 2008 2010 2009 2008 2010 2009 2008 Rate Volume Rate Volume
(Dollars in millions)
Assets
Securities, at amortized cost (1):
U.S. government-sponsored entities (GSE) $ 568 $ 1,400 $ 4,539 3.67% 3.86% 4.86%$21$ 54 $ 221 $ (33) $ (2) (31) $(167) $(39) $(128)
Mortgage-backed securities issued by GSE 22,310 25,419 14,708 3.24 4.14 4.94 723 1,052 727 (329) (211) (118) 325 (133) 458
States and political subdivisions 2,047 2,218 1,841 5.49 5.67 6.33 112 126 116 (14) (5) (9) 10 (13) 23
Non-agency mortgage-backed securities 1,174 1,447 1,642 5.87 5.82 5.81 69 84 95 (15) 1 (16) (11) — (11)
Other securities 313 302 672 2.16 3.90 5.50 712 37 (5) (5) — (25) (9) (16)
Covered securities 1,198 440 — 11.84 11.35 — 142 50 — 92 290 50—50
Total securities 27,610 31,226 23,402 3.89 4.41 5.11 1,074 1,378 1,196 (304) (220) (84) 182 (194) 376
Other earning assets (2) 2,933 2,293 2,255 .55 .79 3.05 17 18 69 (1) (6) 5 (51) (53) 2
Loans and leases, net of unearned income (1)(3)(4)
Commercial loans and leases 48,777 50,074 47,557 4.23 4.21 5.50 2,063 2,110 2,617 (47) 8 (55) (507) (640) 133
Direct retail loans 13,948 14,730 15,580 5.29 5.47 6.47 737 806 1,008 (69) (27) (42) (202) (150) (52)
Sales finance loans 6,766 6,392 6,216 5.87 6.46 6.62 397 413 412 (16) (39) 23 1 (10) 11
Revolving credit loans 2,032 1,855 1,664 8.74 9.51 10.95 178 176 182 2(15) 17 (6) (25) 19
Mortgage loans 15,965 15,927 17,327 5.38 5.72 6.00 859 911 1,039 (52) (54) 2 (128) (46) (82)
Specialized lending 7,778 7,141 5,509 11.46 11.51 12.89 892 822 710 70 (4) 74 112 (82) 194
Other acquired loans 85 52 — 16.43 10.81 — 14 6— 844 6— 6
Total loans and leases held for investment (excluding covered loans) 95,351 96,171 93,853 5.39 5.45 6.36 5,140 5,244 5,968 (104) (127) 23 (724) (953) 229
Covered loans 7,059 3,144 — 13.22 7.39 — 933 232 — 701 272 429 232 — 232
Total loans and leases held for investment 102,410 99,315 93,853 5.93 5.51 6.36 6,073 5,476 5,968 597 145 452 (492) (953) 461
Loans held for sale 2,377 2,831 1,342 3.80 4.81 5.92 90 136 80 (46) (26) (20) 56 (17) 73
Total loans and leases 104,787 102,146 95,195 5.88 5.49 6.35 6,163 5,612 6,048 551 119 432 (436) (970) 534
Total earning assets 135,330 135,665 120,852 5.36 5.17 6.05 7,254 7,008 7,313 246 (107) 353 (305) (1,217) 912
Non-earning assets 24,328 19,517 16,029
Total assets $159,658 $155,182 $136,881
Liabilities and Shareholders' Equity
Interest-bearing deposits:
Interest-checking $ 3,703 $ 2,831 $ 2,376 .30 .39 1.19 11 11 28 —(3) 3 (17) (22) 5
Other client deposits 51,239 45,107 36,676 .64 .88 1.67 326 398 612 (72) (118) 46 (214) (335) 121
Client certificates of deposits 26,872 28,702 26,908 1.97 2.60 3.66 531 747 985 (216) (172) (44) (238) (301) 63
Other interest-bearing deposits 5,217 9,354 9,810 .92 1.23 2.71 49 115 266 (66) (23) (43) (151) (139) (12)
Total interest-bearing deposits 87,031 85,994 75,770 1.05 1.48 2.50 917 1,271 1,891 (354) (316) (38) (620) (797) 177
Federal funds purchased, securities sold under repurchase agreements and
short-term borrowed funds (1) 9,022 12,491 10,580 .28 .50 2.44 26 63 258 (37) (23) (14) (195) (235) 40
Long-term debt 21,653 19,085 19,839 3.96 3.73 4.25 856 711 843 145 46 99 (132) (100) (32)
Total interest-bearing liabilities 117,706 117,570 106,189 1.53 1.74 2.82 1,799 2,045 2,992 (246) (293) 47 (947) (1,132) 185
Noninterest-bearing deposits 19,742 16,387 13,061
Other liabilities 5,324 4,987 4,098
Shareholders' equity 16,886 16,238 13,533
Total liabilities and shareholders' equity $159,658 $155,182 $136,881
Average interest rate spread 3.83% 3.43% 3.23%
Net interest margin/net interest income 4.03% 3.66% 3.58%$5,455 $4,963 $4,321 $492 $186 $306 $ 642 $(85) $ 727
Taxable-equivalent adjustment $ 135 $ 119 $ 83
(1) Yields are stated on a fully taxable-equivalent basis assuming tax rates in effect for the periods presented.
(2) Includes Federal funds sold, securities purchased under resale agreements or similar arrangements, interest-bearing deposits with banks, trading securities, FHLB stock and other earning assets.
(3) Loan fees, which are not material for any of the periods shown, have been included for rate calculation purposes.
(4) Nonaccrual loans have been included in the average balances.
68